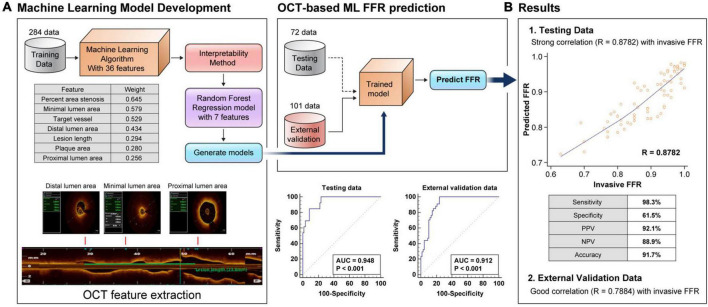
FIGURE 1.
Flow chart of the OCT-based machine learning method and weight of each feature (A). Comparison between the clinical fractional flow reserve results and the predicted fractional flow reserve results in the random forest model in the testing set and external validation set, and receiver operating characteristic curve of machine learning-fractional flow reserve (B). FFR, fractional flow reserve; AUC, area under the curve.

