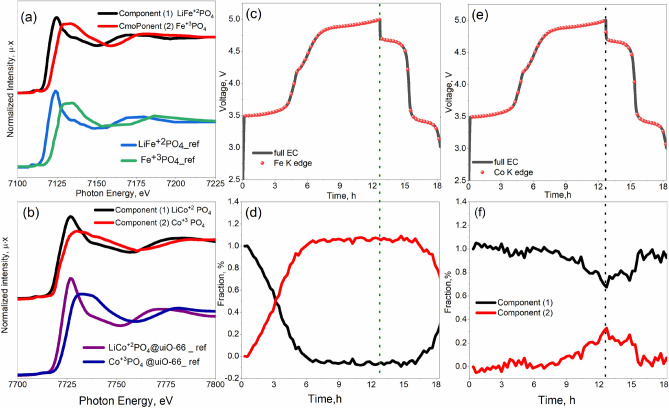
Figure 6.
PCA components extracted from the series of operando XANES spectra for the Fe compared to the experimental spectra for LiFePO4 and FePO4 (ref.40) (a) and Co (b) K-edge in the LiCo0.5Fe0.5PO4 cathode material, compared to the experimental spectra of the reference compounds (LiCoPO4@UiO-66)7. (c) Cell voltage of Fe during the first cycle dots on a black voltage profile mark the start time for measuring each successive XAS spectrum. (d) PCA phase concentration of the Fe2+ and Fe3+ components compared to the cell potential. (e) Cell Voltage of Co during the first cycle dots on a black voltage profile marks the start time for measuring each successive XAS spectrum. (f) PCA phase concentration of the Co2+ and Co3+ components compared to the cell potential.

