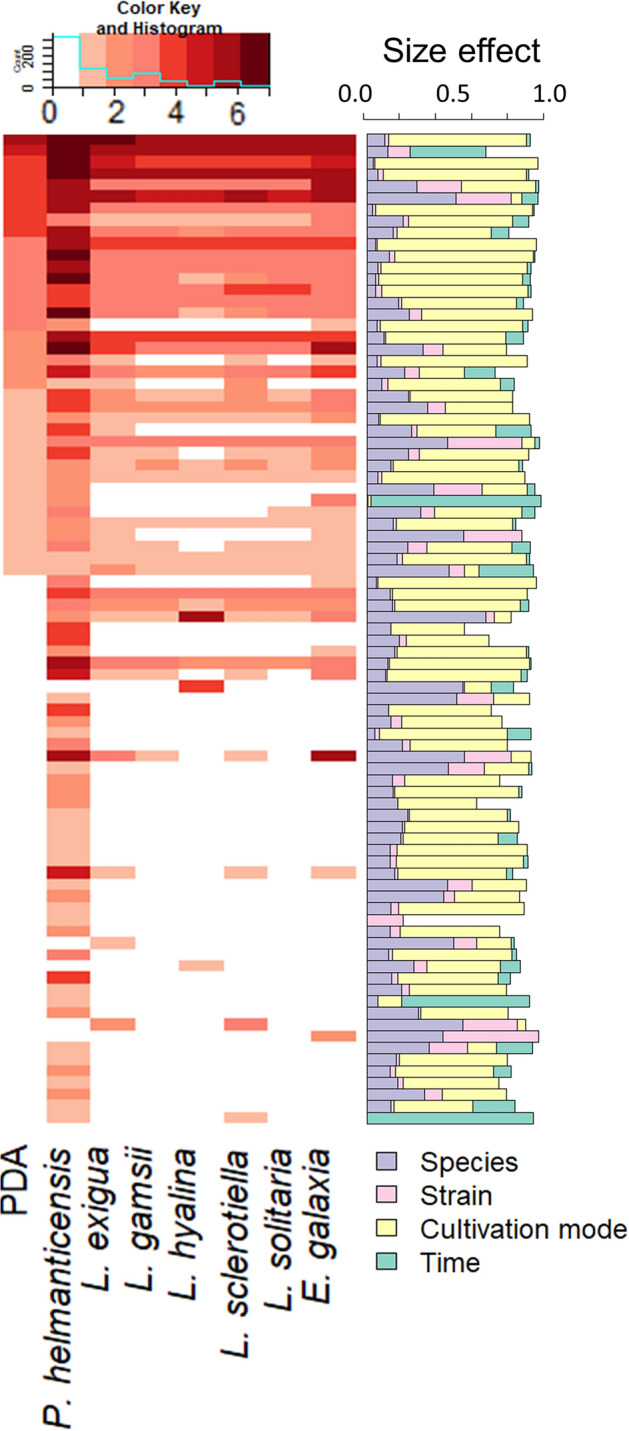
Figure 3.

Concentrations of volatile organic compounds (VOCs) measured for sterile PDA medium and for pure cultures of P. helmanticensis and the Linnemannia and Entomortierella species studied here, and how they are affected by experimental factors (species, strain, cultivation mode and time). The concentrations of VOCs were measured by PTR-ToF-MS. The heatmap illustrates the mean concentrations of VOCs (rows) in PDA medium, P. helmanticensis pure cultures, and pure cultures of the fungal species (columns). For visualisation purposes, the concentrations were grouped: 0 = concentration < 0.2 bbpV; 1 = 0.2 ppbV ≤ concentration < 0.5 ppbV; 2 = 0.5 ppbV ≤ concentration < 1 ppbV; 3 = 1 ppbV ≤ concentration < 5 ppbV; 4 = 5 ppbV ≤ concentration < 10 ppbV; 5 = 10 ppbV ≤ concentration < 20 ppbV; 6 = 20 ppbV ≤ concentration < 50 ppbV; 7 = concentration ≥ 50 ppbV. The barchart visualizes the effect size of the experimental factors on the respective VOC concentration as calculated by ANOVA. The proportion of sum of squares explained by each factor was used as effect size.
