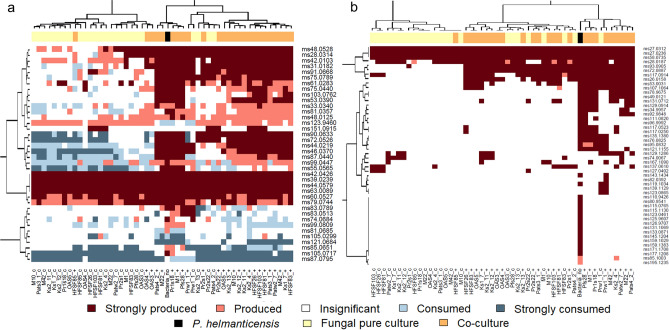
Figure 4.
The production/consumption of volatile organic compounds (VOCs; rows) by pure fungal strains and pure Pseudomonas helmanticensis, as well as by their respective co-cultures (columns). A VOC detection limit of 0.2 ppbV was set. Both heatmaps visualise the mean VOC concentrations of the sample groups relative to the VOC concentration measured in PDA. (a) VOCs produced by PDA medium. The concentration in the respective sample group can be comparable to PDA, higher than PDA (production) or lower than PDA (consumption). (b) VOCs undetected in PDA medium. These VOCs were produced exclusively by the cultures. Production/Consumption of all VOCs indicated by colour was significant compared to PDA medium (p < 0.05). Strong production/consumption means that the respective VOC’s concentration was more than twofold higher/lower compared to its concentration measured for PDA medium.

