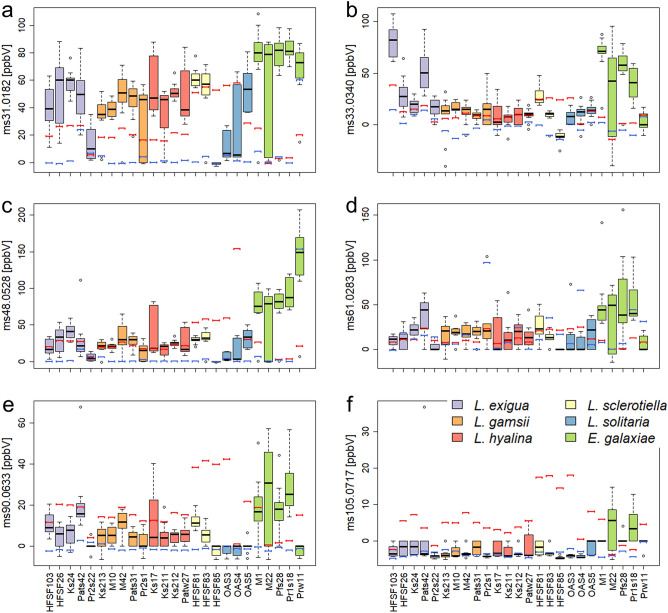
Figure 6.
Concentrations of volatile organic compounds (VOCs) that might be potentially regulated in co-cultures of Mortierellaceae strains and P. helmanticensis. Those VOCs whose concentrations in co-culture were not predictable from both pure cultures were identified by linear models. The figure visualizes the measured co-culture concentrations in ppbV in all co-culture sample groups. The red bar indicates the predicted VOC concentration from linear modelling (model 1). The blue bar indicates the pure culture concentration. (a) ms31.0182 = tentatively annotated (t.a.) as formaldehyde, (b) ms33.0340 = t.a. methanol, (c) ms48.0528 = ethanol, (d) ms61.0283 = acetic acid, (e) ms90.0633 = acetoin, (f) ms105.0717 = phenylethanol.

