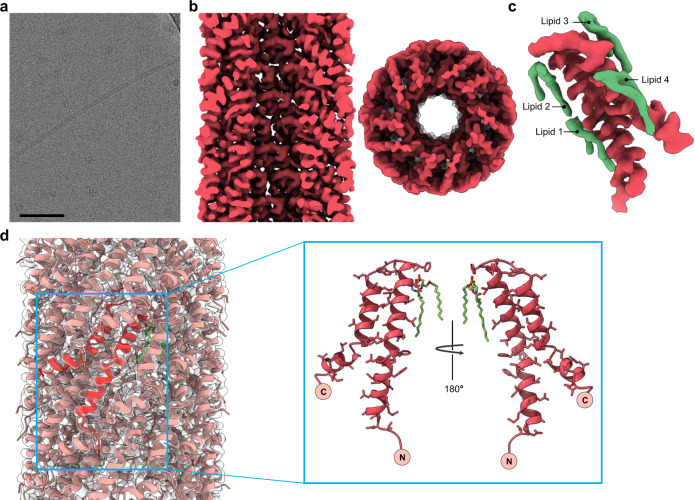
Fig. 3. Structure of the A. tumefaciens T-pilus.
a Representative cryo-electron micrograph of A. tumefaciens T-pilus, from 8,363 images collected. Scale bar, 50 nm. b Side and top view of the T-pilus cryo-EM density map at a resolution of 3.5 Å. The front half of the filament has been removed in the side view, and we are looking at the lumen. c While there is a 1:1 stoichiometry of lipids to pilins in the filament, a pilin (red) makes contact with four lipids (green). d Atomic model of the T-pilus in ribbon representation docked within the transparent cryo-EM density map. A single subunit model is shown in red. An inset on the right shows front and back views of the VirB2 subunit.

