Figure 2.
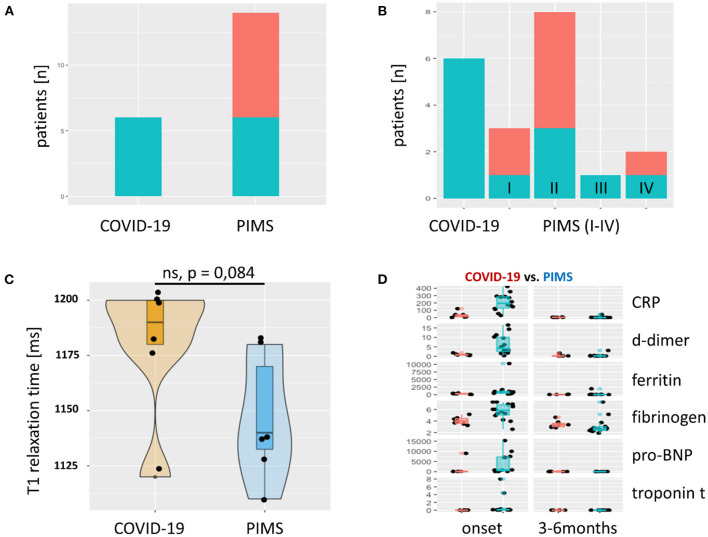
Late Gadolinium Enhancement (LGE) and T1 relaxation times and laboratory results. (A) The absolute frequency of LGE as bar graph. LGE (green) was found in every severe acute COVID-19 patient. In the group of patients with PIMS, we observed LGE in 6/14 (43%). Red = unaffected patients. In (B), the PIMS group was divided into four subgroups: (I) Kawasaki-like without shock symptoms, (II) Kawasaki-like with shock, (III) PIMS without shock, and (IV) PIMS with shock. LGE could not be attributed to one of these four subgroups, although a trend toward group II Kawasaki with shock symptoms was seen. T1 relaxation time in areas of the myocardium with LGE is shown in (C) as violin plots with superimposed scatter plots. This shows a prolongation of relaxation time above the norm (< 1,100 ms, determined in 20 healthy subjects) in both groups. Patients with severe acute COVID-19 showed an even more pronounced prolongation of T1 relaxation time than patients with PIMS. There was no significant difference between the two groups (p = 0.084). Solid line = median. Markers of inflammation and myocardial damage of patients with COVID-19 (red) and PIMS (blue) at the time of disease onset and last visit are compared in (D). All markers are more elevated in PIMS group but normalize completely until the last visit after 3–6 months. CRP, C-reactive protein [mg/L]; d-dimer [mg/L fibrinogen equivalent units], ferritin [ng/L], fibrinogen [g/L], pro-BNP, pro-brain natriuretic peptide [pg/mL], troponin t [ng/mL].

