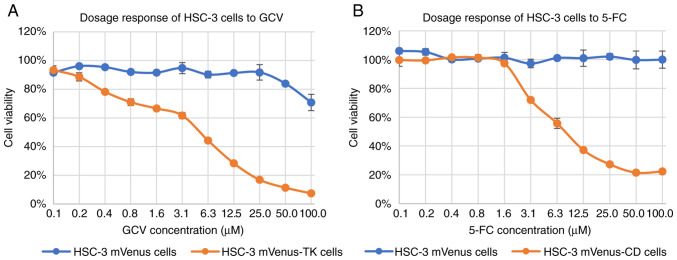
Figure 2.
Dose-response of HSC-3 cells to GCV or 5-FC treatment. (A) Dose-response curve of HSC-3 cells treated with GCV. HSC-3 mVenus or HSC-3 mVenus-TK cells were treated with 2-fold dilutions of GCV ranging from 0.1 to 100.0 µM for three days. (B) Dose-response curve of HSC-3 cells treated with 5-FC. HSC-3 mVenus or HSC-3 mVenus-CD cells were treated with 2-fold dilutions of 5-FC ranging from 0.01 to 100.0 µM for three days. Cell viability was measured and normalized to untreated cells. Data are presented as mean ± SD of three experiments. CD, cytosine deaminase; TK, thymidine kinase; GCV, ganciclovir; 5-FC, 5-fluorocytosine; SD, standard deviation.

