Figure 4.
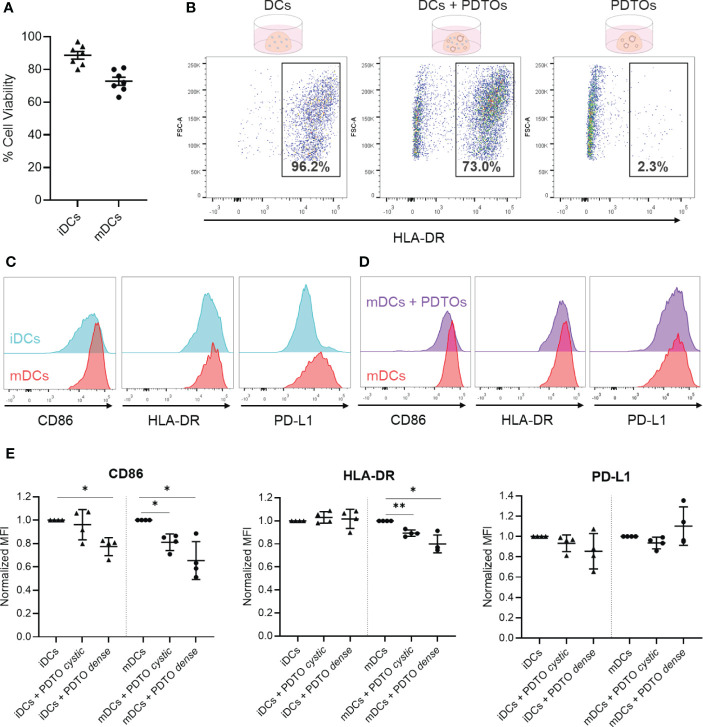
Recovery of DCs after co-culture with tumor PDTOs - viability, gating strategy, and phenotypic characterization to assess tumor-induced phenotypical changes. (A) DCs viability was assessed by trypan blue staining after collagenase treatment to disassemble the collagen scaffold (before centrifugation). (B) For flow cytometry analysis, cells were gated based on size, single cells, and live cells. Depicted is the HLA-DR-based gating strategy to distinguish PDTOs and DCs, using three conditions: DCs only, DCs and PDTOs co-culture, and PDTOs only. (C) Representative histogram plots to exemplify basal expression of CD86, HLA-DR, and PD-L1 markers in iDCs and mDCs. (D) Representative histogram plot of CD86, HLA-DR and PDL-1 to highlight the phenotypic shift of mDCs cultured in the presence of PDTOs. (E) Scattered dot plots showing normalized MFI values to iDCs and mDCs, respectively. Each dot/triangle represents a different donor, 4 donors were used in total. Data plotted as normalized values of raw MFI, mean with SD. The statistical significance between different conditions (mDCs/iDCs with and without PDTOs) was analyzed by a mixed-effects model followed by a Dunnett’s post-hoc multiple comparisons test on the log2 transformed ratio values. The statistical significance was annotated as follows: *p < 0.05, **p < 0.01. (Raw data can be found in Supplementary Figure 5 ).

