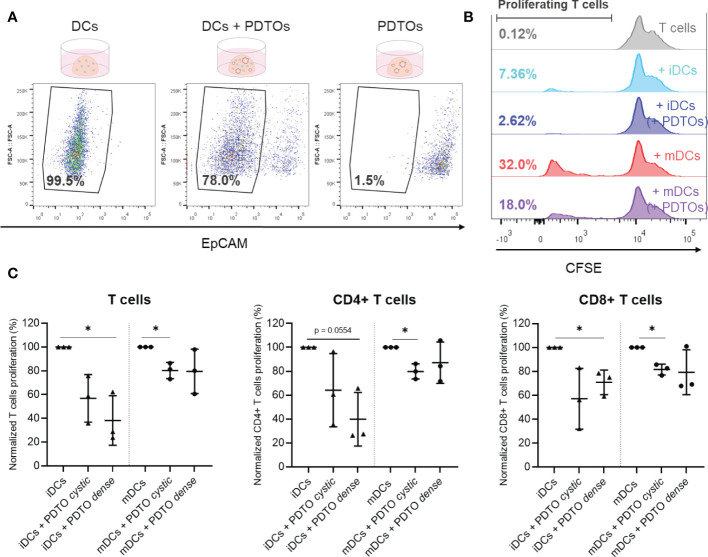
Figure 5.
Sorting and functional characterization of DCs after co-culture with PDTOs – Allogeneic T cell assay. (A) Isolation of DCs, using EpCAM to sort out PDTOs. DCs gate defined based on EpCAM expression. (B) Representative CFSE histogram plots are shown. Numbers indicate the percentage of gated proliferating T cells. (C) Proliferation of allogeneic T cells after 6 days of co-culture with sorted DCs. Scattered dot plots show the percentage of proliferating T cells in each condition (average of technical replicates), normalized to proliferating T cells in the conditions with only iDCs and mDCs, respectively, mean with SD. The statistical significance between different conditions (mDCs/iDCs with and without PDTOs) was analyzed by a mixed-effects model followed by a Dunnett’s post-hoc multiple comparisons test on the log2 transformed ratio values. The statistical significance was annotated as follows: *p < 0.05. (Raw data can be found in Supplementary Figure 6 ).

