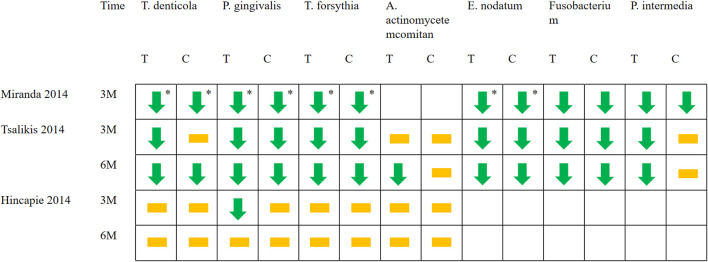
FIGURE 7.
Changes in bacterial species applied with systemic antibiotics. Green arrows represent the decrease of a certain bacteria in this period compared with baseline (p < 0.05). The yellow squares represent that compared with the baseline, although there are numerical changes in the number of bacteria, there is no statistical difference. * Represents between-group differences (p < 0.05). T represents test group and C represents control group.

