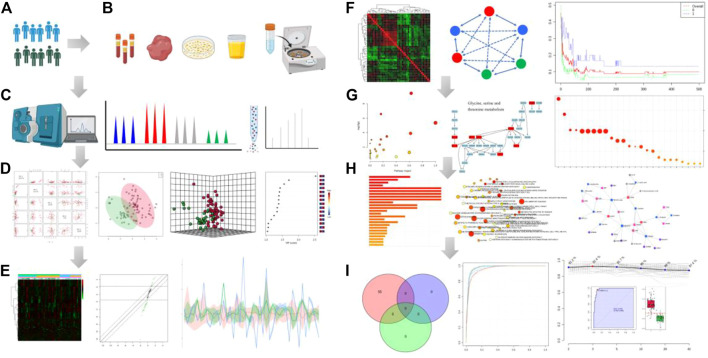
FIGURE 1.
Analytical workflow of typical metabolomic analysis. It includes several basic steps: experimental design (A), sample collection (B), metabolite profling (C), data analysis (D−F), functional interpretation (G, H) and potential application of the integrated datasets (I). Step (A) The experimental design based on phenotype analysis or diagnosis and treatment. Step (B) Sample preparation through deproteinization and/or centrifugation of biofluids. Step (C) Metabolite separation on a column (chromatography) and detection of analyte signal through MS or NMR spectroscopy. Metabolites can be identified on the basis of a combination of retention time and MS signature. Step (D) The data pre-processing and normalization of raw signals). Then, pattern recognition analysis and computational methods after data collection. Step (E) Expression analysis of the differential metabolites by which data is filtered for significant biomarkers of interest. Heatmap plot shows the differential metabolites in the statistical analysis function. Step (F) Clustering correlation patterns analysis among different data sets. Step (G) Pathway enrichment overview. Circle size and color are based on the pathway size and p-value. Step (H) The enriched metabolism pathway and joint pathway analysis in the correlation network. Step (I) Analysis model of diagnosis, prognosis and treatment based on the candidate metabolite features using classical univariate and multivariate ROC curve analyses. All images were obtained using the example data provided by the MetaboAnalyst 5.0 and figures also created by BioRender.

