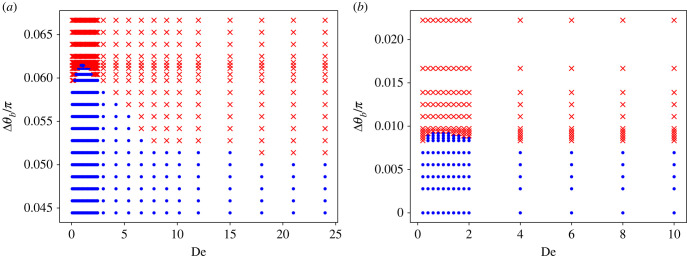
Figure 11.
(a) Cluster stability diagram for stiff sheets as a function of Δθb and De. De ≈ 1 represents the most stable condition. Here, L/rc = 9.375, ω/ωref = 1.54, ζl/ζref = 1638.4, κ/κref = 304 and Sp = 0.43. (b) Cluster stability diagram for soft sheets as a function of Δθb and De. Here, L/rc = 18.75, ω/ωref = 1.54, ζl/ζref = 1638.4, κ/κref = 304 and Sp = 1.02. The dots denote a stable cluster, while the crosses correspond to an unstable cluster.

