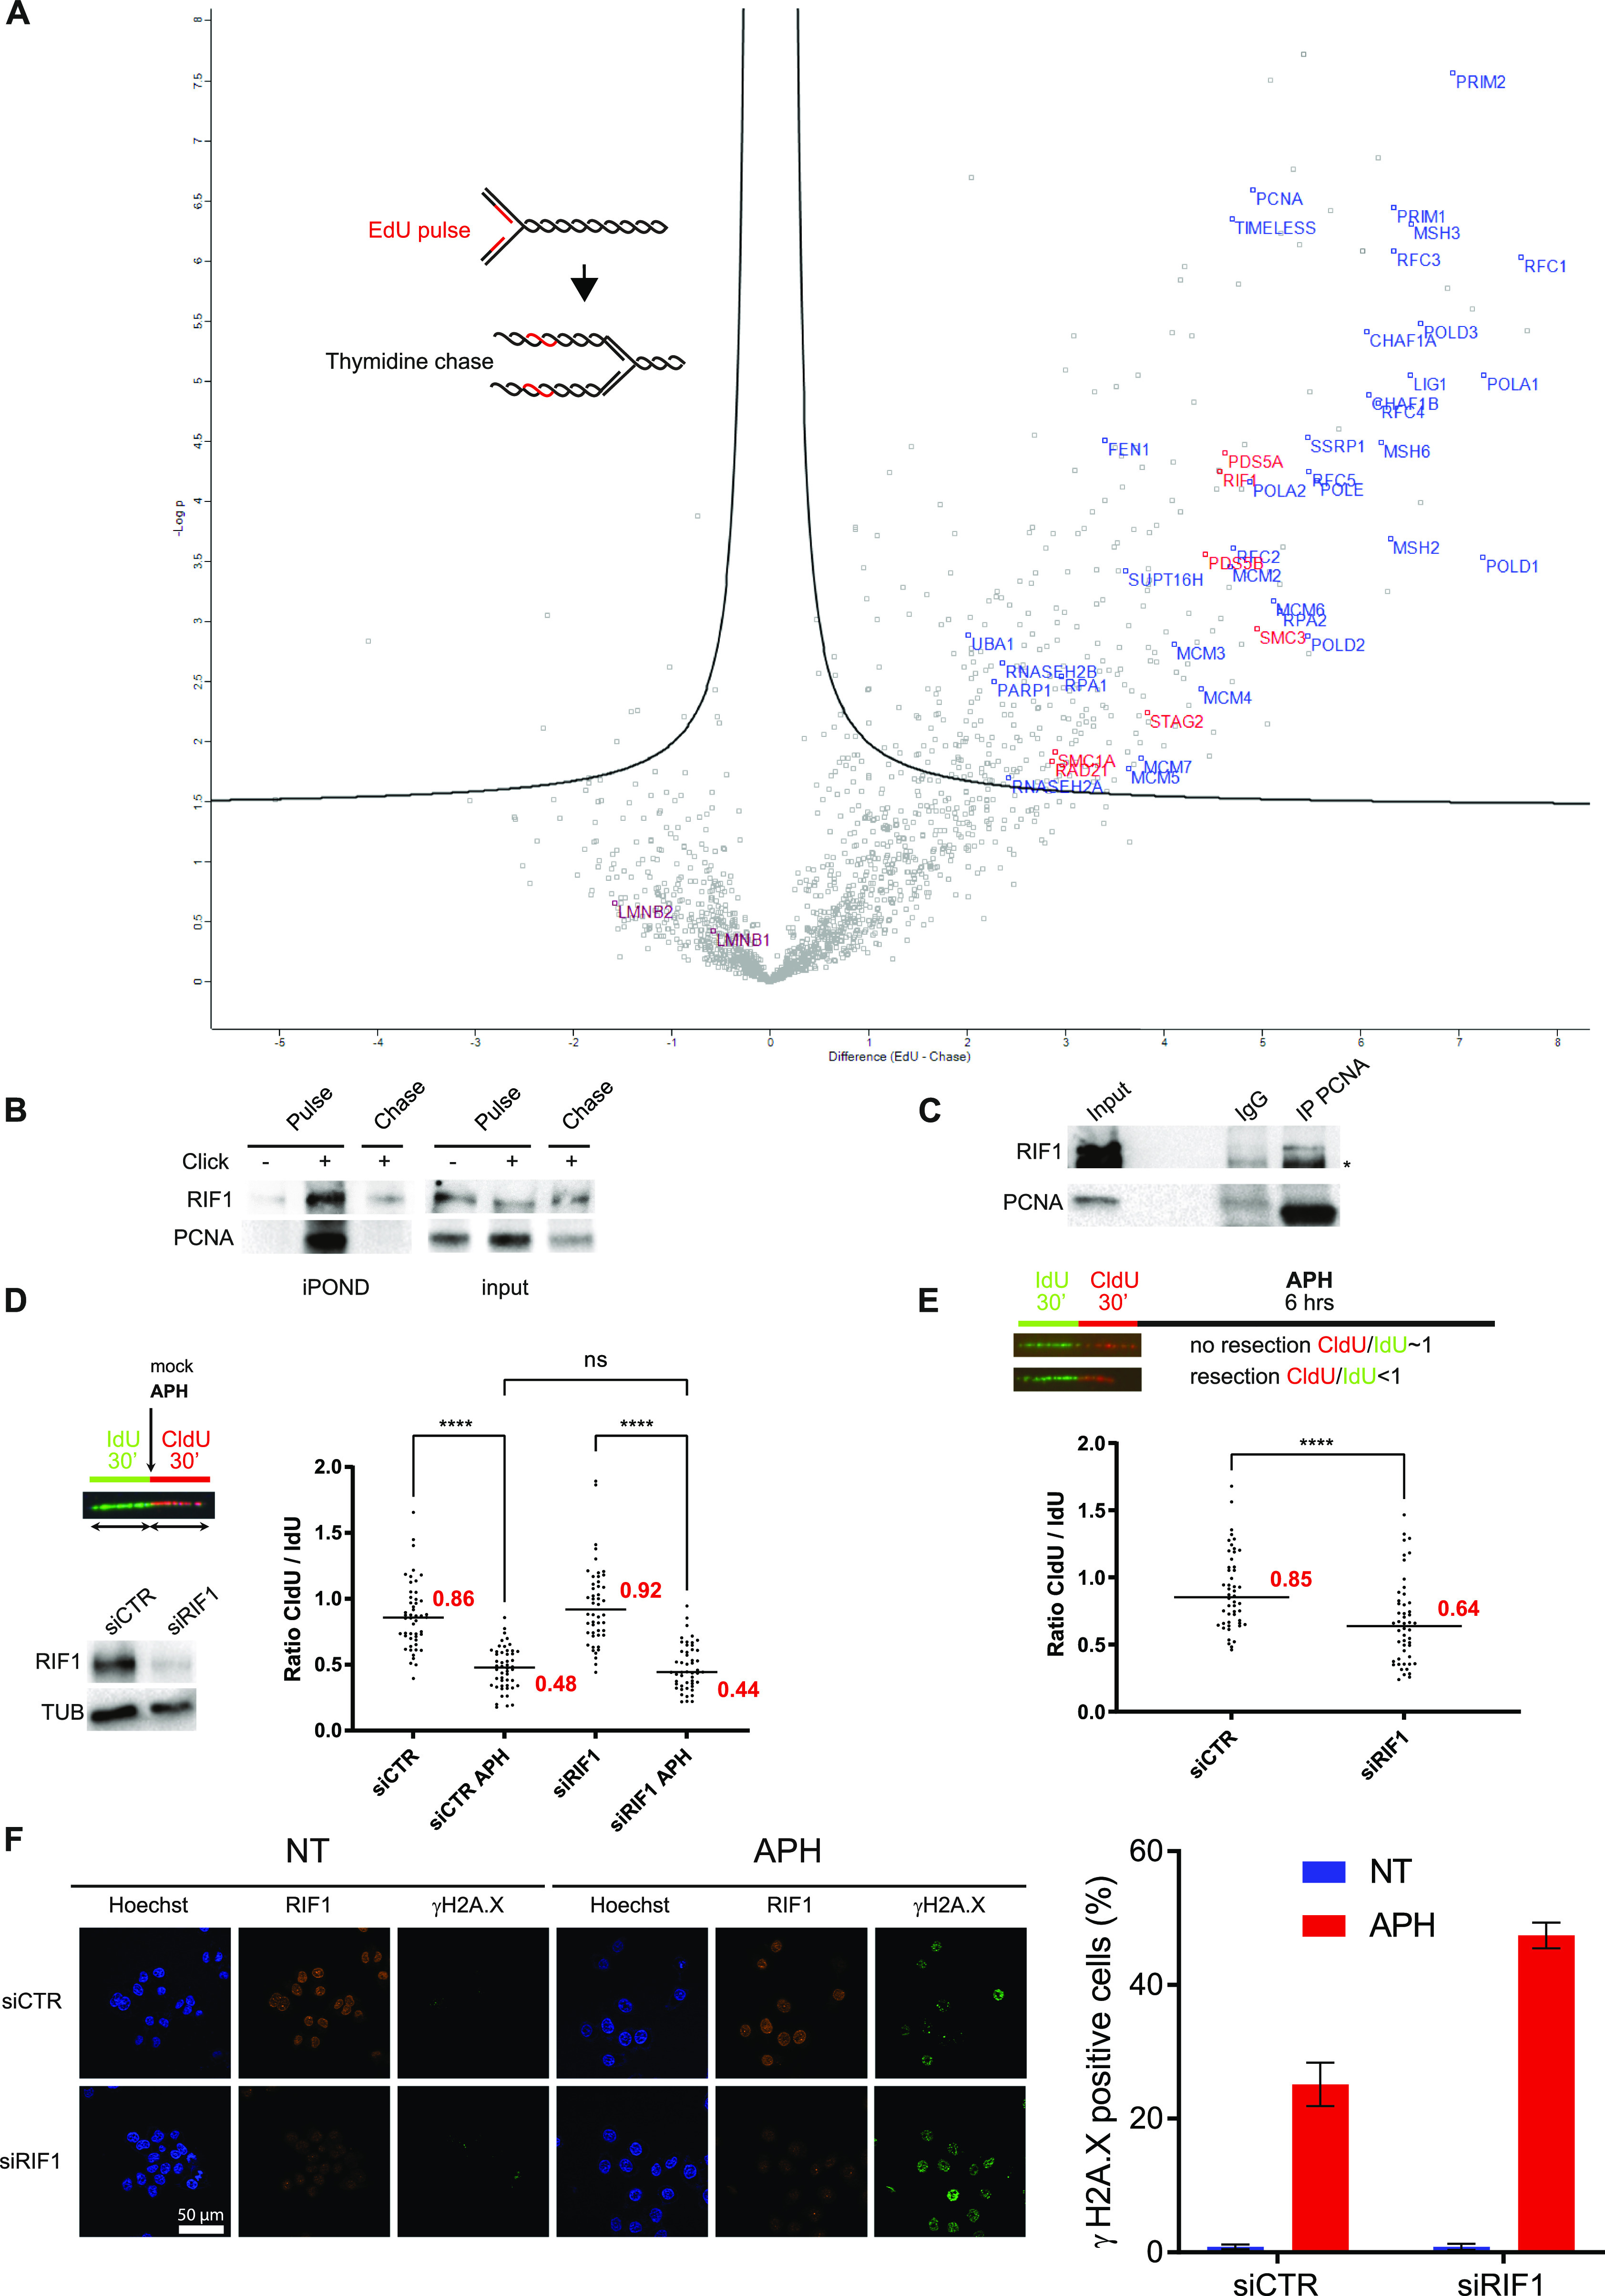
Figure 1. RIF1 is associated with nascent DNA and is required to limit DNA lesions in response to prolonged aphidicolin treatment.

(A) iPOND coupled with mass spectrometry. HeLa S3 cells were pulse-labeled with EdU or pulse-labeled with EdU followed by a 120-min thymidine chase, then subjected to iPOND, and analyzed by mass spectrometry. Label-free quantification was performed using MaxQuant (Cox & Mann, 2008) and statistical analysis using Perseus (Tyanova et al, 2016). Pulse experiments have been performed six times and chase experiments four times. Examples of replisome-specific proteins are indicated on the right side of the figure above the line. Full protein list is available in Table S1. (B) Indicated proteins were isolated by iPOND and detected by Western blotting. HeLa S3 cells were pulse-labeled with EdU for 15 min and chased with thymidine for 120 min. In no-click samples, biotin–TEG azide was replaced by DMSO. (C) Western blot analysis of indicated proteins after immunoprecipitation with an antibody directed against PCNA or against mouse IgG. (D) DNA fiber labeling and Western blot analysis of RIF1 depletion. HeLa S3 cells were labeled for 30 min with IdU and then for 30 min with CldU in the absence or presence of 0.05 μM aphidicolin (APH) in the cell culture medium. Graphic representation of the ratios of CldU versus IdU tract length. For statistical analysis, a Mann–Whitney test was used, ns, non-significant; ****P < 0.0001. The horizontal bar represents the median with the value indicated in red. 50 replication tracts were measured for each experimental condition. (E) Analysis of DNA resection using DNA fiber labeling. HeLa S3 cells were labeled for 30 min with IdU and then for 30 min with CldU. 1 μM aphidicolin (APH) was added in the cell culture medium for 6 h. Graphic representation of the ratios of CldU versus IdU tract length. For statistical analysis, a Mann–Whitney test was used, ****P < 0.0001. The horizontal bar represents the median with the value indicated in red. 50 replication tracts were measured for each experimental condition. (F) Immunofluorescence analysis of γH2A.X and RIF1 in HeLa S3 cells with siRNA against control or RIF1 in the presence or absence of aphidicolin (APH) for 24 h. Graphic representation of the percentage of γH2A.X–positive cells based on three independent experiments.
