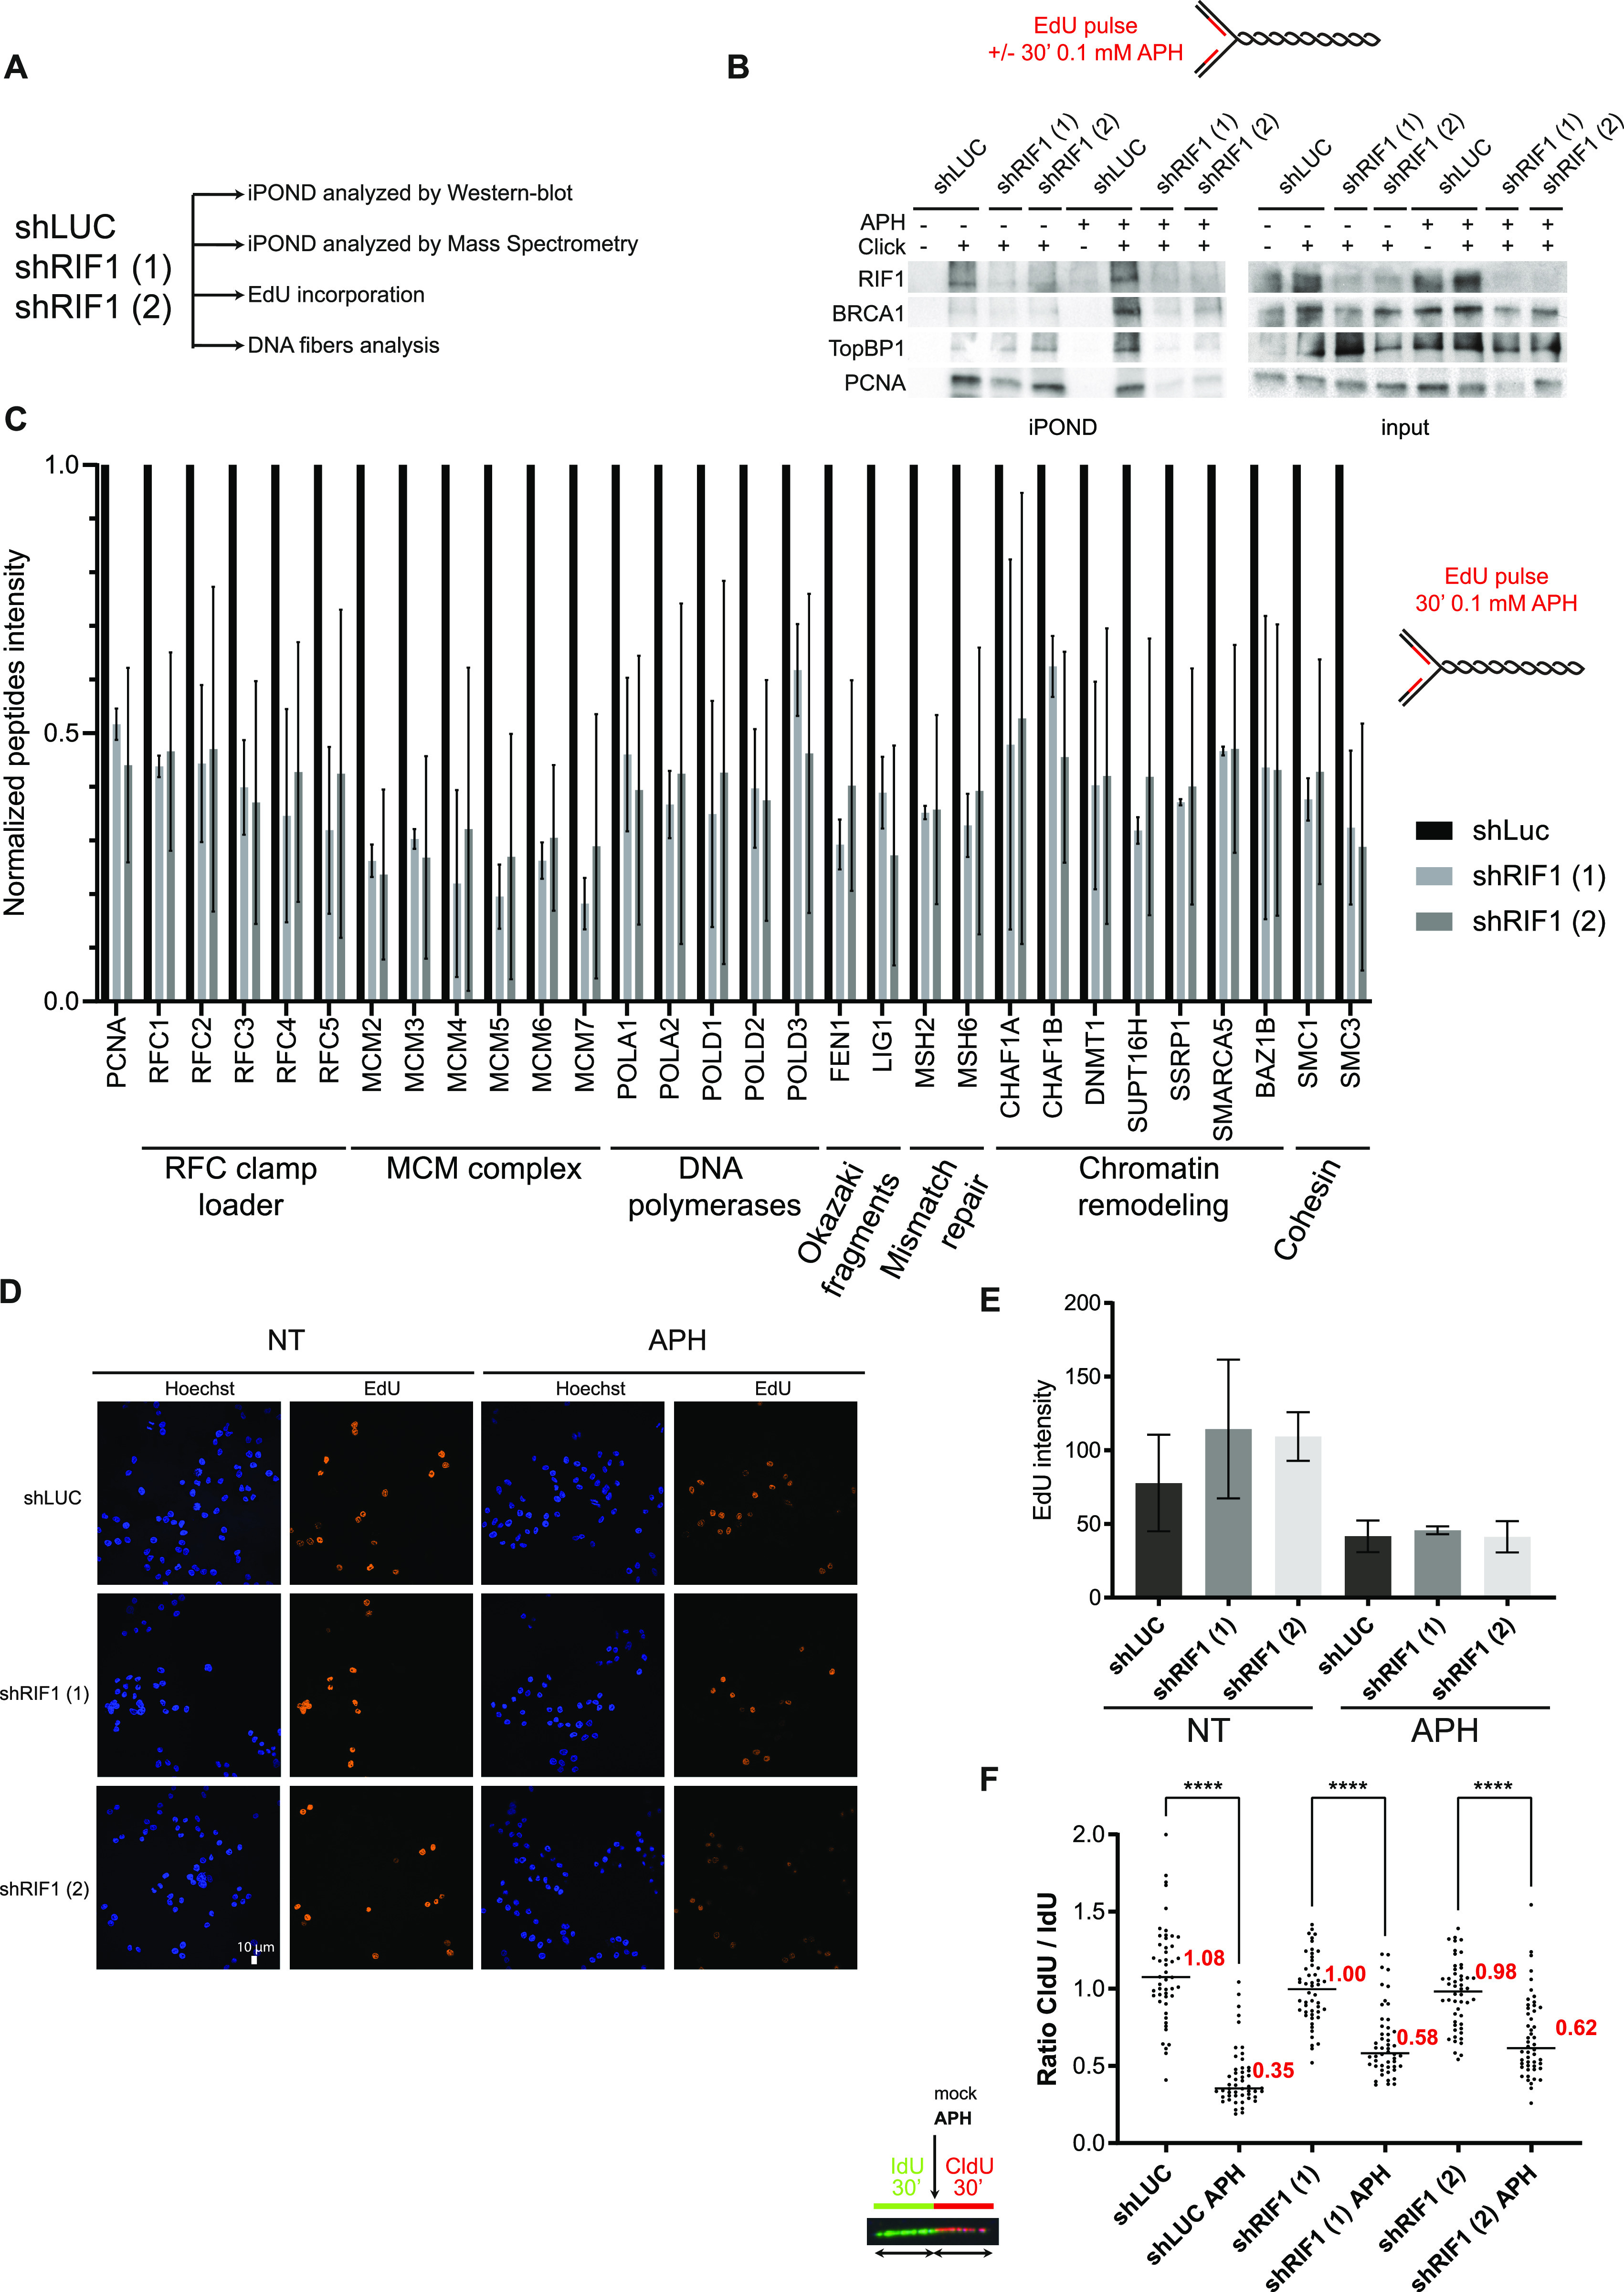
Figure 3. RIF1 loss reduces the efficacy of protein isolation on nascent DNA.

(A) Experimental setup. (B) iPOND experiment. HeLa S3 cells (with shLUC or two different shRIF1) were labeled with EdU for 15 min or for 30 min with 0.1 μM aphidicolin (APH). Indicated proteins were analyzed by Western blotting. In no-click samples, biotin–TEG azide was replaced by DMSO. (C) iPOND-MS experiment. HeLa S3 cells (with shLUC or two different shRIF1) were labeled with EdU for 30 min EdU with 0.1 μM aphidicolin (APH). Quantification of peptide intensity for each protein was performed using MaxQuant; individual values are available in Table S2. The ratios of shRIF1 (1) or shRIF1 (2) versus shLUC are shown. The error bars represent the variation of two experiments for shRIF1 (1) and three experiments for shRIF1 (2). Because of normalization, there are no error bars for shLUC, but the experiment was performed three times. (D) Analysis of EdU incorporation using microscopy in HeLa S3 cells with shRNA against luciferase or RIF1. EdU was incorporated in cells during 15 min with or without 0.1 μM aphidicolin (APH). (E) Quantification of EdU intensity within nucleus stained with Hoechst was performed using CellProfiler and is represented on the histogram. Error bars correspond to the average values of three independent experiments. (F) DNA fiber labeling. HeLa S3 cells were labeled for 30 min with IdU and then for 30 min with CldU in the absence or presence of 0.05 μM aphidicolin (APH) in the cell culture medium. Graphic representation of the ratios of CldU versus IdU tract length. For statistical analysis, a Mann–Whitney test was used, ****P < 0.0001. The horizontal bar represents the median with the value indicated in red. At least 50 replication tracts were measured for each experimental condition.
