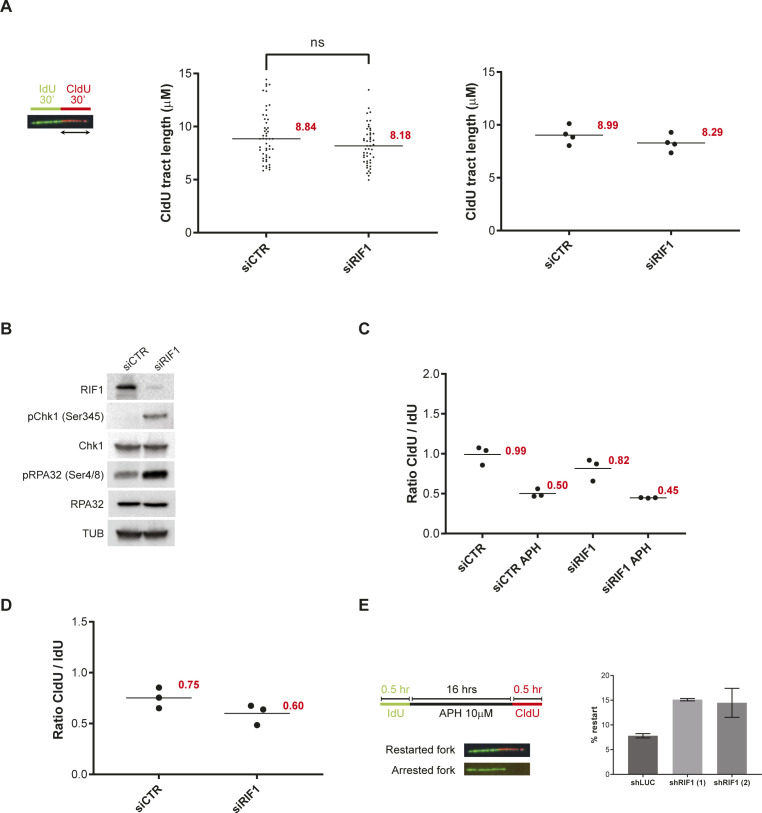
Figure S1. Impact of RIF1 depletion on replication stress.
(A) DNA fiber labeling. HeLa S3 cells were labeled for 30 min with IdU and then for 30 min with CldU. Graphic representation of the ratios of CldU tract length. The horizontal bar represents the median with the value indicated in red. For statistical analysis, a Mann–Whitney test was used, ns, non-significant. At least 50 replication tracts were measured for each experimental condition. The second graphic representation is showing the average of four independent experiments. (B) Western blot analysis of the indicated proteins upon transfection with siRNA directed against RIF1 or a control target. (C) This graphic representation is showing the average of the three independent experiments from Fig 1D. (D) This graphic representation is showing the average of the three independent experiments from Fig 1E. (E) Analysis of replication restart upon APH treatment using DNA fiber labeling. HeLa S3 cells were labeled for 30 min with IdU, then treated 16 h with 10 μM APH and then for 30 min with CldU. Graphic representation of the percentage of restart based on three independent experiments.

