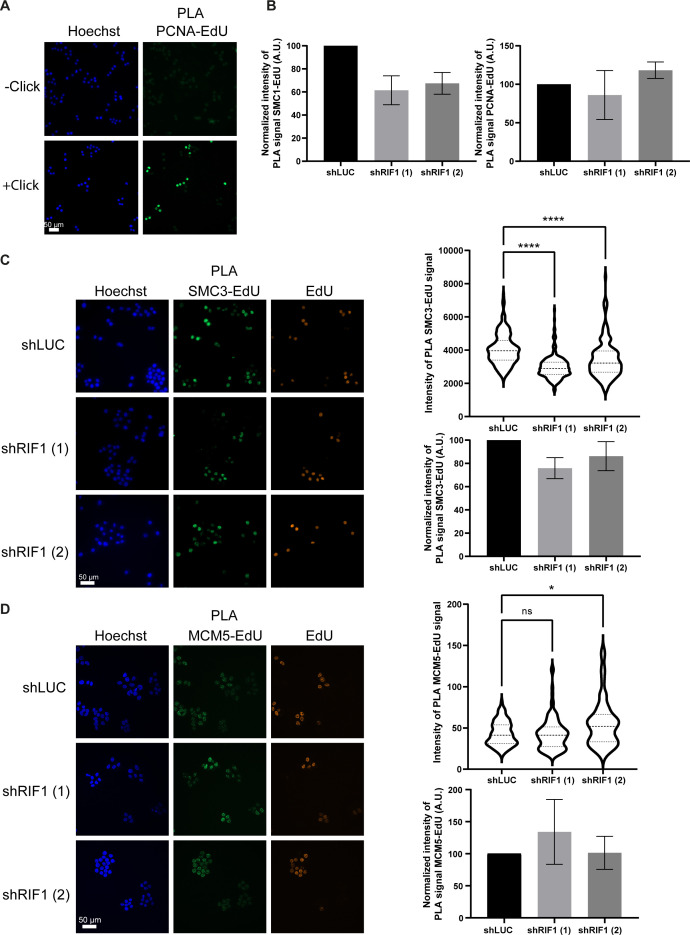
Figure S5. RIF1 is required for full recruitment of SMC3 at replication forks.
(A) Immunofluorescence analysis of PLA signal between EdU and PCNA; in −click control, the biotin–TEG azide was replaced by DMSO. (B) Graphic representation of the average PLA signal (normalized to 100 in shLUC) from three independent experiments corresponding to Fig 5C. (C) Immunofluorescence analysis of PLA signal between EdU and SMC3 upon 30-min treatment with 0.1 μM APH in HeLa S3 cells expressing shRNAs against luciferase or RIF1. EdU-positive cells were labeled with Alexa Fluor 555. The level of PLA signal within the nucleus was quantified using CellProfiler. Graphic representation of the PLA signal; at least 100 cells were quantified in each condition. For statistical analysis, a Mann–Whitney test was used, ****P < 0.0001. Graphic representation of the average PLA signal (normalized to 100 in shLUC) from three independent experiments. (D) Immunofluorescence analysis of PLA signal between EdU and MCM5 upon 30-min treatment with 0.1 μM APH in HeLa S3 cells expressing shRNAs against luciferase or RIF1. EdU-positive cells were labeled with Alexa Fluor 555. The level of PLA signal within the nucleus was quantified using CellProfiler. Graphic representation of the PLA signal; at least 100 cells were quantified in each condition. For statistical analysis, a Mann–Whitney test was used, ****P < 0.0001. Graphic representation of the average PLA signal (normalized to 100 in shLUC) from three independent experiments.

