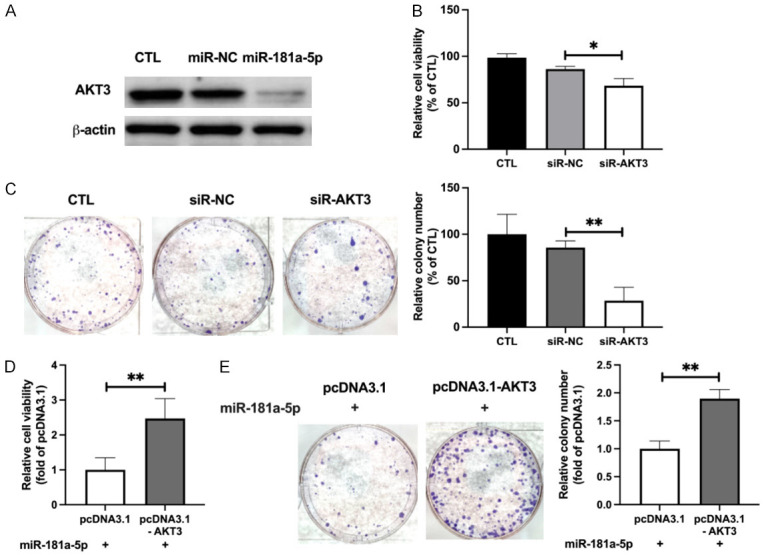
Figure 4.

Downregulation of AKT3 expression contributes to the anti-UM effect of miR-181a-5p. A. Western blotting analysis of AKT3 protein levels in OMM2.5 cells with or without transfection of miR-181a-5p. B. Cell viability of siR-AKT3 transfected OMM2.5, measured and presented as a percentage of CTL. *P < 0.05 vs. siR-NC. C. Colony formation of siR-AKT3 transfected OMM2.5 cells (left) and relative colony numbers (right). **P < 0.01 vs. siR-NC. D. OMM2.5 cells were co-transfected with miR-181a-5p and AKT3 expression plasmid for 48 h, cell viability was measured, and relative values with respect to those in the miR-181a-5p+pcDNA3.1 group are presented. **P < 0.01 vs. miR-181a-5p+pcDNA3.1. E. Representative images of colony formation of co-transfected OMM2.5 cells (left), and relative colony numbers (right). **P < 0.01 vs. miR-181a-5p+pcDNA3.1.
