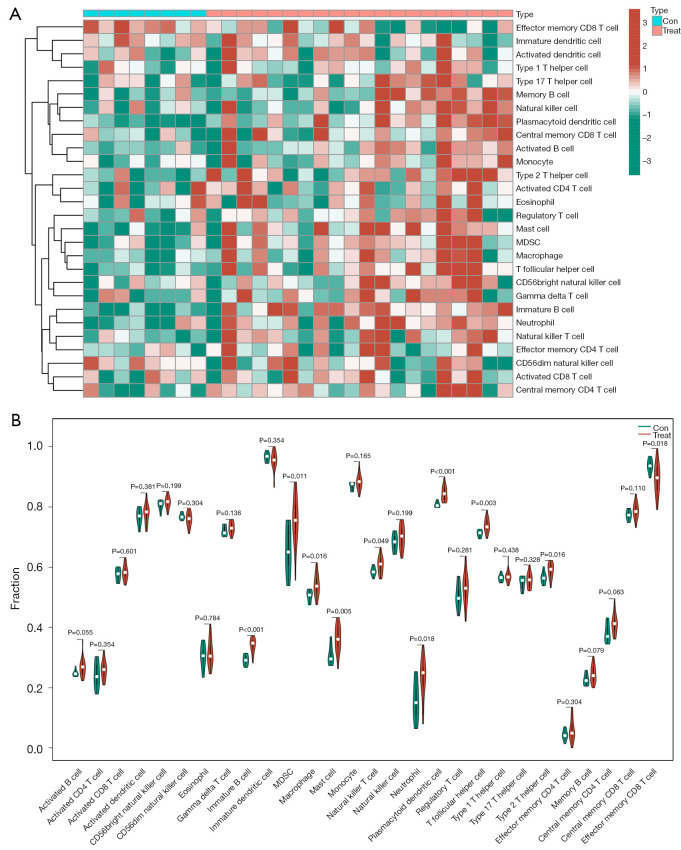
Figure 5.
Immunogene set analysis of immune infiltration patterns in PD and normal conditions. (A) Heat maps of immunogene set analysis of PD samples and the color of the columns represents the gene expression of the tissue samples, with red indicating high expression and green indicating low expression. (B) Violin plot showing the difference in infiltrating immune cells between the two groups. PD, Parkinson’s disease; MDSC, myeloid-derived suppressor cell.

