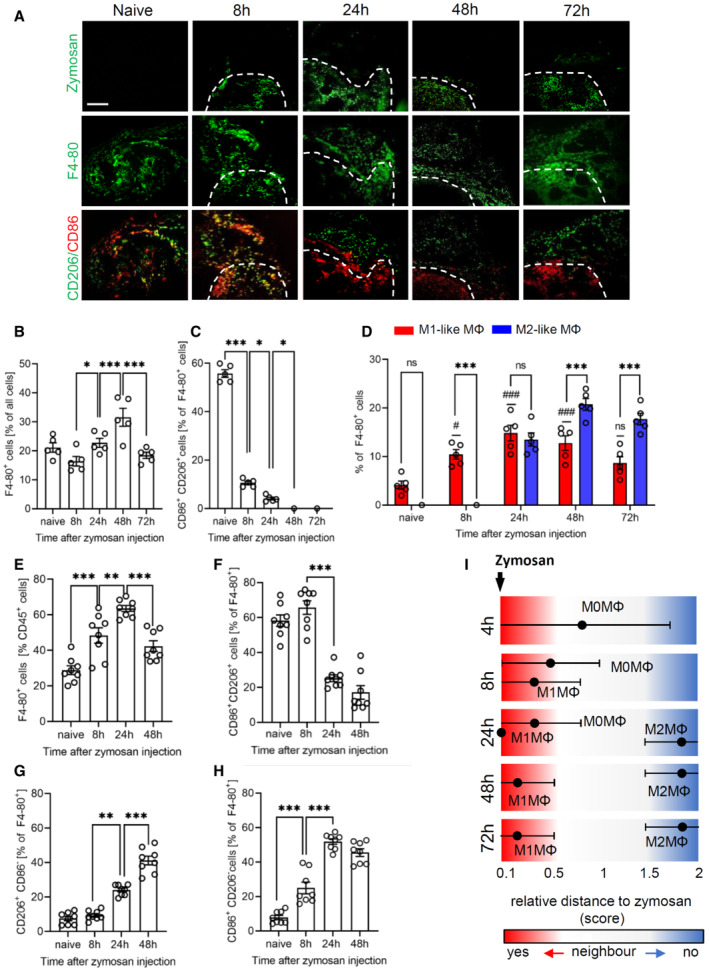
Figure 1. M1‐ and M2‐like macrophages arrange at distinct distances around zymosan.

-
ARepresentative MELC images showing the distribution of macrophage polarization markers at the indicated time points after injection of FITC‐labeled zymosan (3 mg/ml, 10 μl) in one hind paw. White dotted lines show the position of zymosan. Size bar represents 100 μm.
-
B–DQuantification of the number of macrophages and their subtypes 8, 24, 48, and 72 h after zymosan injection based on the MELC images. Data are shown as mean (n = 5 mice) ± SEM, one‐way ANOVA/Bonferroni *P < 0.05, ***P < 0.001. # P < 0.05, ### P < 0.001 as compared to naïve mice.
-
E–HFACS analysis of macrophages and their subtypes 8, 24 and 48 h after zymosan injection. Data are shown as mean (n = 8 mice) ± SEM, one‐way ANOVA/Bonferroni **P < 0.01, ***P < 0.001.
-
IRelative distances from the zymosan‐containing area based on the probability for an immediate neighborhood of macrophage subtypes at the indicated time points after zymosan injection. Data are shown as mean (n = 5 mice) ± SEM.
Source data are available online for this figure.
