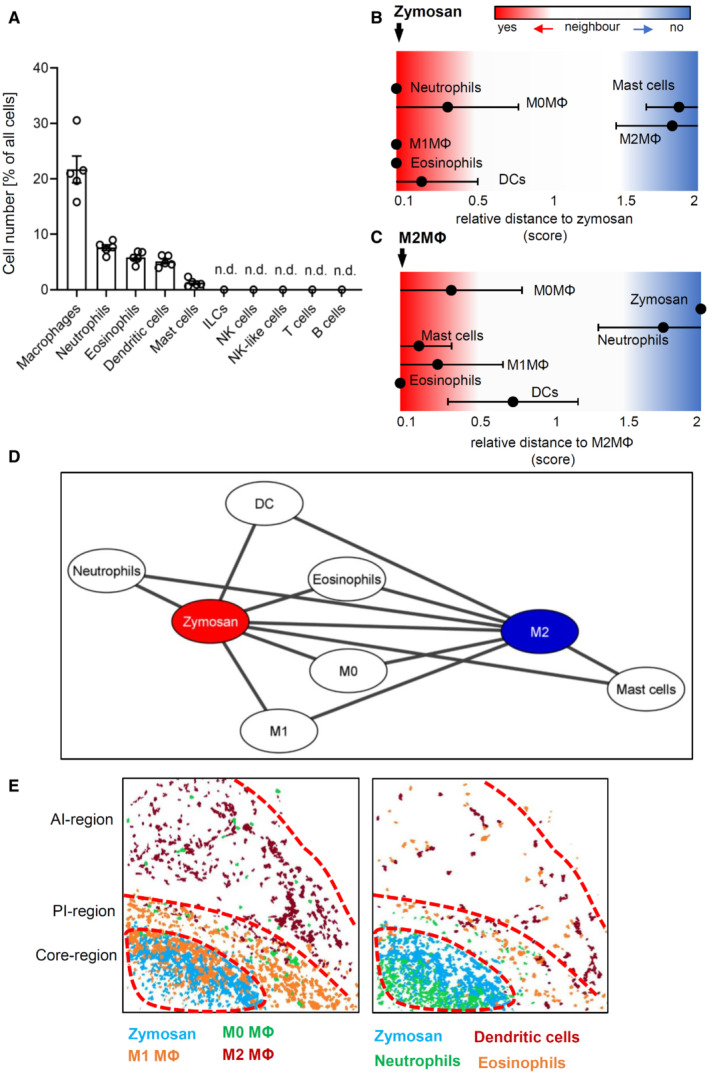
Figure 2. Based on immune cell distribution three inflammatory regions can be defined.

-
AFrequency of different immune cell types in the MELC images 24 h after zymosan injection. Data are shown as mean (n = 5 mice) ± SEM (n.d., not determinable).
-
B, CRelative distance of various immune cell types based on the likelihood for an direct neighborhood of macrophage subtypes in regard to zymosan (panel B) or M2‐like macrophages (panel C).
-
DNetwork visualization using Cytoscape of the cellular neighborhoods of zymosan and M2‐like macrophages. The distances between the cells in the visualization represents the statistical likelihood of being direct neighbors.
-
EComposite MELC images showing the position of the core‐, the proinflammatory (PI) and the anti‐inflammatory (AI) regions in the tissue in regard to the localization of M1‐ and M2‐like macrophages (MΦ) and zymosan (left panel) or eosinophils, neutrophils and DCs (right panel). The red dotted lines depict the area where the transition between the neighboring regions occurs.
Source data are available online for this figure.
