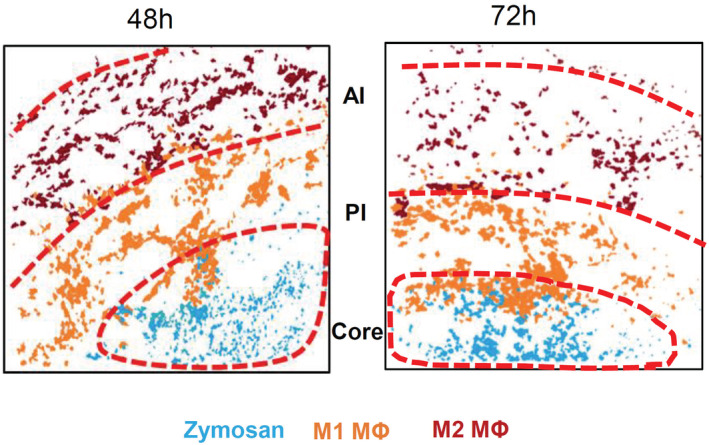
Figure EV2. Distribution of macrophage subpopulation 48 and 72 h after zymosan injection.

Composite MELC images 24 and 72 h after zymosan injection showing the position of the core‐, PI‐ and the AI‐regions in the tissue in regard to the localization of M1‐ and M2‐like macrophages (MΦ) and zymosan. The red dotted lines depict the area where the transition between the neighboring regions occurs.
