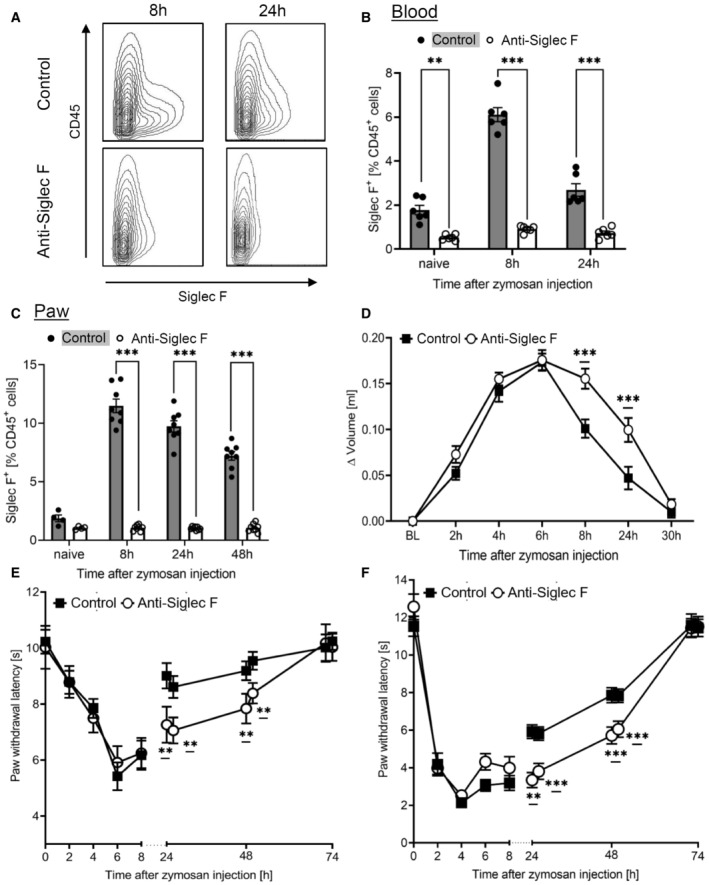
Figure 4. Eosinophil depletion delays resolution of zymosan‐induced inflammation.

-
A–CFACS analysis of eosinophils in the blood (panel A,B; n = 6 mice) or paws (panel C; n = 8 mice) at the indicated time points after zymosan injection. Anti‐Siglec F antibody or the IgG‐control (control) was administered with 0.883 mg/kg 24 h prior zymosan injection. Data are shown as mean ± SEM, student's t‐test *P < 0.05, **P < 0.01, ***P < 0.001 vs. control mice.
-
DPaw volume after injection of zymosan. Data are presented as mean ± SEM (n = 8–10 mice). Two‐way ANOVA/Bonferroni, ***P < 0.001.
-
E, FZymosan‐induced mechanical (panel E) and thermal (panel F) hypersensitivity of control or anti‐Siglec F antibody‐treated mice. Data are shown as the mean ± SEM (n = 8 mice). Two‐way ANOVA/Bonferroni, **P < 0.01, ***P < 0.001 vs. control mice.
Source data are available online for this figure.
