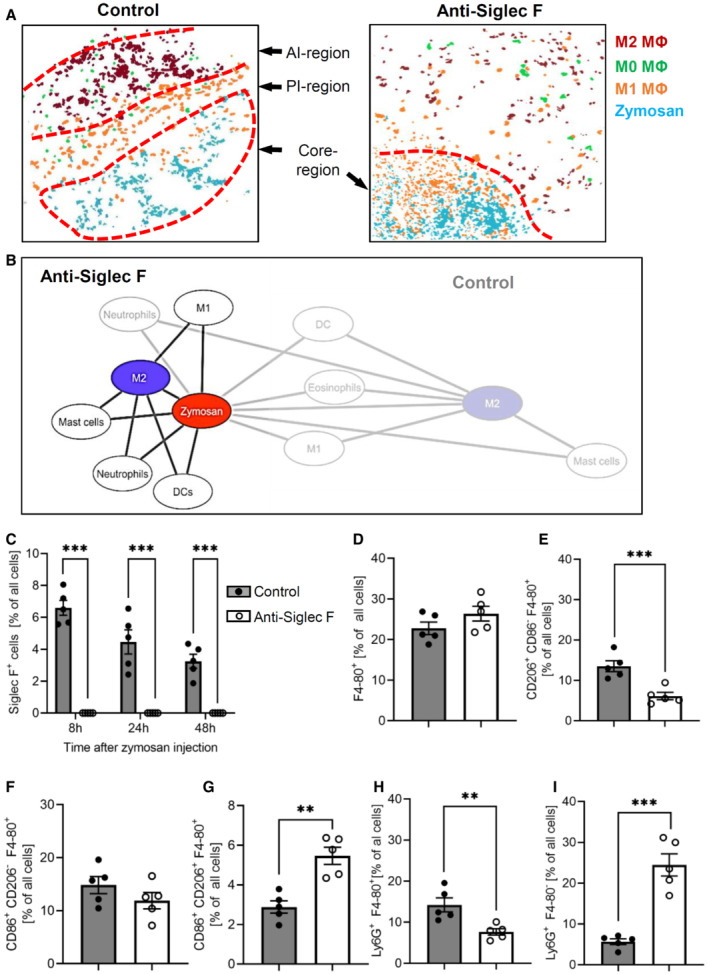
Figure 5. Eosinophils maintain inflammatory regions.

-
AComposite MELC image showing the disappearance of the PI‐ and the AI‐regions 24 h after zymosan injection in control or eosinophil‐depleted mice. The red dotted lines depict the area where the transition between the neighboring regions occurs.
-
BNetwork visualization of the cellular neighborhoods of zymosan and M2‐like macrophages 24 h after zymosan injection in eosinophil‐depleted mice superimposed on control (transparent labels and lines as shown in Fig 2C).
-
C–IQuantification of eosinophils, the sum of all macrophages, M2‐like, M1‐like, and M0‐macrophages (panels C–G) as well as efferocytosis (panel H) and neutrophils (panel I) in the MELC images of paws from control or eosinophil‐depleted mice 24 h after zymosan injection. Data are presented as mean ± SEM (n = 5). Student's t‐test, **P < 0.01, ***P < 0.001.
Source data are available online for this figure.
