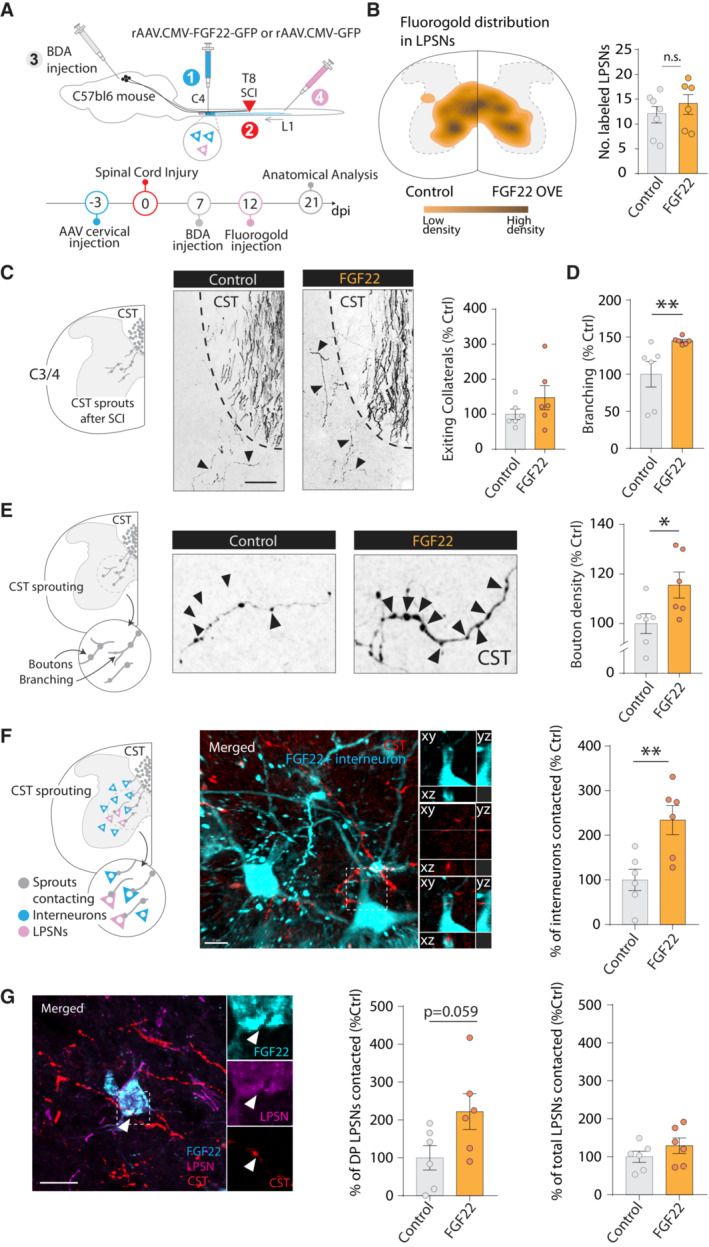
Figure 3. Nonselective FGF22 gene therapy promotes widespread circuit rewiring.

- Schematic illustration and time line of the experiment, in which we administered FGF22 before the spinal cord lesion.
- Schematic of the location of fluorogold‐labeled LPSN in control and FGF22 overexpressing mice. Quantification of the number of fluorogold‐labeled LPSN. Each dot represents individual animal (n = 6–7 animals per group).
- Schematic illustration of the hCST collateral exiting into the cervical cord and confocal images showing exiting hCST collaterals in control (left panel) and FGF22 treated (right panel) mice and quantification of the number of hCST collaterals that enter the cervical gray matter 3 weeks following spinal cord injury (n = 6 mice per group).
- Quantification of branching points on newly formed cervical hCST collaterals in control and FGF22 treated mice (n = 6 mice per group).
- Schematic illustration of the boutons on cervical hCST collateral and confocal images showing putative synaptic boutons (arrows) on newly formed cervical hCST collaterals at 3 weeks following spinal cord injury in a FGF22 (right) and a control (left) mice. Quantification of bouton density in control and FGF22 treated mice (n = 6 mice per group).
- Schematic illustration of the hCST contacts onto relay neurons in the cervical cord and confocal images showing contacts between CST collaterals (red) and cervical interneurons (cyan). Insets represent 3D views generated in Imaris of the confocal image. Quantification of the contacts between the hCST collaterals and cervical interneurons neurons (n = 6 per group).
- Confocal images showing contacts between CST collaterals (red) and long propriospinal neurons (magenta) transduced with FGF22 (cyan). Quantification of the contacts between the hCST collaterals and long propriospinal transduced with FGF22 or control virus (DP refers to double positive cells). Insets on the right are magnification of the boxed area on the left (n = 6 mice per group).
Data information: ns: P > 0.05; *P < 0.05 and **P < 0.01. Unpaired t‐test for panels (E, F) and (G) and Mann–Whitney test for panel (D). The data are presented as means ± SEM. Scale bar equals 50 μm in panel (C); 10 μm in panel (F, G). Images in (E) are magnified five times from (C). Arrowheads in (C) represent exiting CST collaterals. Arrowheads in (D) represent bouton on hCST collaterals. Arrowhead in (G) represents putative contact between hCST collateral and FGF22 overexpressing LPSN.
