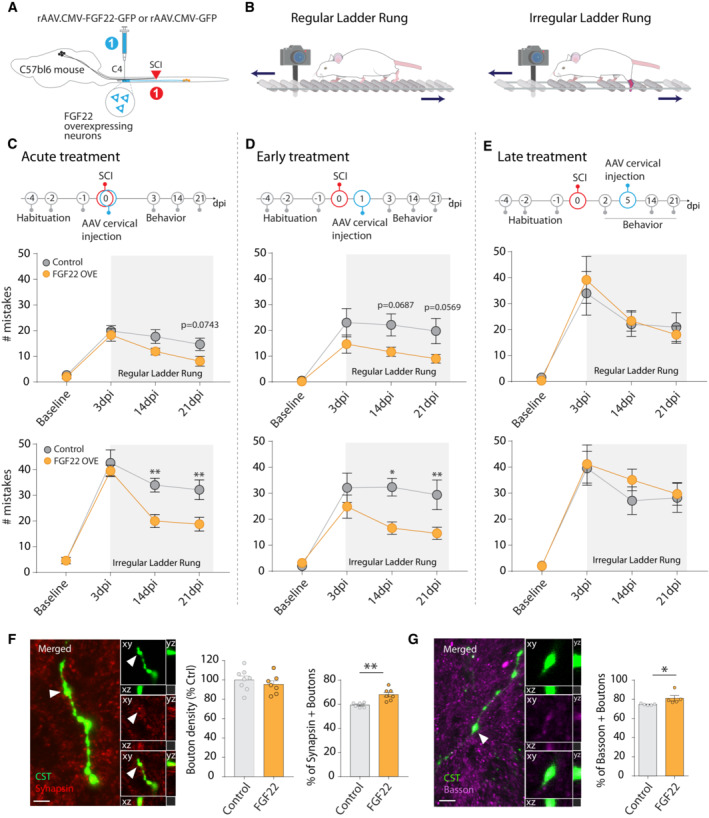
Figure 4. Postinjury therapeutic treatment with AAV‐CMV‐FGF22‐ires‐GFP triggers functional recovery in the ladder rung test.

- Schematic illustration of the experimental design for therapeutic postinjury treatment with FGF22 following spinal cord injury.
- Illustration of regular (left) and irregular (right) ladder rung used to test functional recovery following spinal cord injury.
- Time line of the experiment with FGF22 injection right after the onset of the spinal cord lesion (top). Quantification of the functional recovery in the regular (middle) and irregular (bottom) ladder rung test in controls (gray) and FGF22 (orange) treated mice at baseline, at 3 days postinjury (“3 dpi”), 14 and 21 dpi after spinal cord injury (n = 9–10 mice per group).
- Time line of the experiment with FGF22 injection 24 h after the onset of the spinal cord lesion (top). Quantification of the functional recovery in the regular (middle) and irregular (bottom) ladder rung test in control (gray) and FGF22 (orange) treated mice at baseline, at 3 days postinjury (“3 dpi” or 2 days “2 dpi” for the late treatment), 14 and 21 dpi after spinal cord injury (n = 9–10 per group).
- Time line of the experiment with FGF22 injection 5 days after the onset of the spinal cord lesion (top). Quantification of the functional recovery in the regular (middle) and irregular (bottom) ladder rung test in control (gray) and FGF22 (orange) treated mice at baseline, at 3 days postinjury (“3 dpi”), 14 and 21 dpi after spinal cord injury (n = 9–10 per group).
- Representative confocal image of CST boutons (green) and synapsin staining (red) and quantification of the percentage of bouton synapsin positive (n = 6–7 mice per group).
- Representative confocal images of CST bouton (green) and bassoon staining (magenta) and quantification of the percentage of boutons that are bassoon positive (n = 5–6 mice per group).
Data information: Insets in (F) and (G) represent 3D views generated in Imaris of the confocal images. *P < 0.05 and **P < 0.01. ANOVA with the Šidak's post hoc test in (C–E) and t‐test in (F, G). The data are presented as means ± SEM. Scale bars equals 10 μm in (F, G). Arrowhead in (F) represents hCST bouton expressing synapsin. Arrowhead in (G) represents hCST bouton expressing bassoon.
