
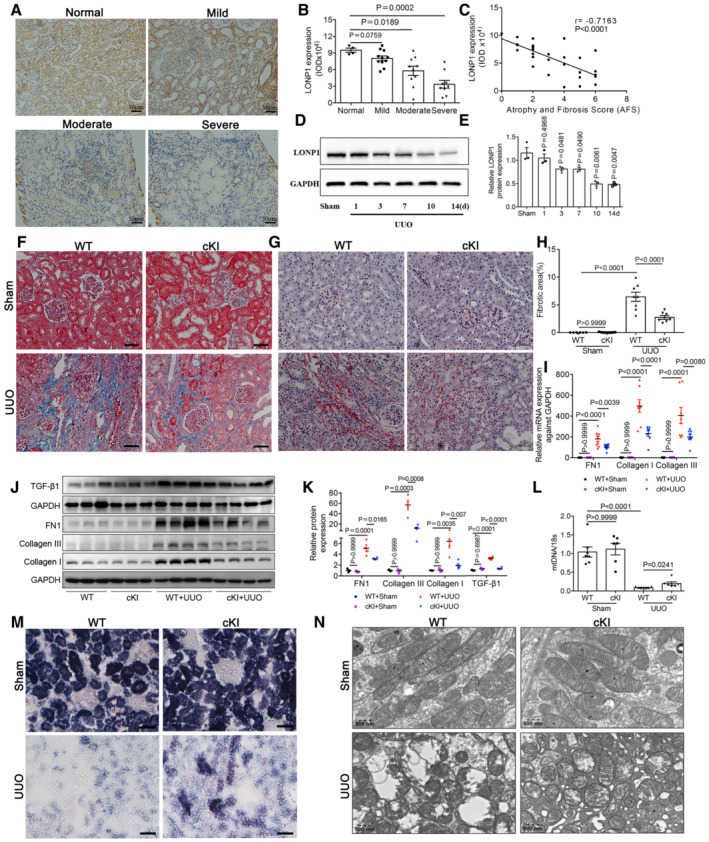
Figure 1. LONP1 is down‐regulated in the kidneys of CKD patients and mice and proximal tubular‐specific overexpression of Lonp1 alleviates renal injury and mitochondrial dysfunction in UUO model.
-
AImmunohistochemical analysis of LONP1 expression in CKD children with mild (n = 11), moderate (n = 10), or severe fibrosis (n = 9). N = 4 in Normal group. Scale bar: 50 μm.
-
BImmunohistochemical semi‐quantitative IOD analysis of LONP1.
-
CPearson correlation analysis of LONP1 and atrophy and fibrosis score (AFS) in renal biopsy specimens.
-
DWestern blot analysis for the expression of LONP1 in UUO models at different time points.
-
EDensitometric analysis for the expression of LONP1 (n = 3, biological replicates).
-
FDeposition of total fibrosis in kidney tissues was determined by Masson's trichrome staining. Scale bar: 50 μm.
-
GSirius red staining in WT and cKI mice after UUO. Scale bar: 50 μm.
-
HFibrotic area statistics of Sirius red staining in WT and cKI mice after UUO (n = 6 in WT+Sham group, n = 8 in cKI+Sham or WT+UUO group, n = 7 in cKI+UUO group, biological replicates).
-
IqRT‐PCR analysis of FN1, Collagen I and Collagen III in WT and cKI mice after UUO (n = 7 in WT+Sham group, n = 8 in the other three groups, biological replicates).
-
J, KWestern blot and densitometric analysis for the expression of FN1, Collagen I, Collagen III and TGF‐β1 (monomer) in WT and cKI mice after UUO (n = 3 or 4, biological replicates).
-
LqRT‐PCR analysis of mtDNA expression in WT and cKI mice after UUO (n = 6 or 7, biological replicates).
-
MSuccinate dehydrogenase (SDH) staining in WT and cKI mice after UUO. Scale bar: 50 μm.
-
NTransmission electron microscopy images of the mitochondria in tubular cells in WT and cKI mice after UUO. Scale bar: 500 nm.
Data information: In (B, E), data are presented as mean ± SEM. Student's t‐test. In (H–L), data are presented as mean ± SEM. One‐way ANOVA.
Source data are available online for this figure.