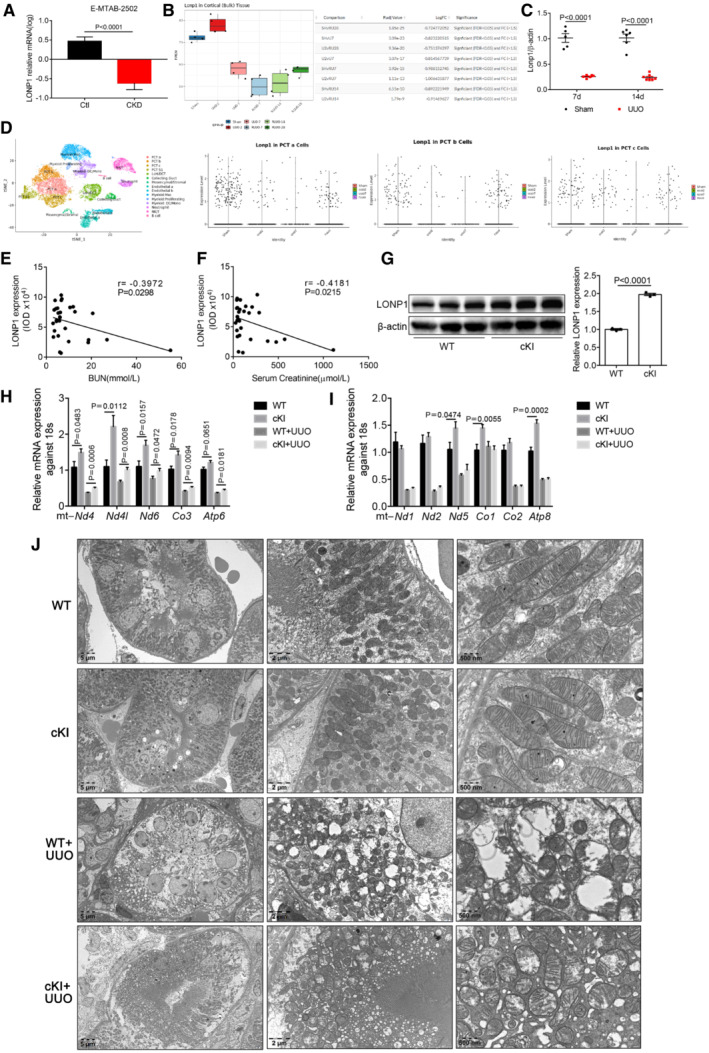
Figure EV1. LONP1 was down‐regulated in CKD kidneys based on the analysis of online datasets and proximal tubular‐specific overexpression of Lonp1 alleviated the reduction of mitochondrial genes expression and protected mitochondrial morphology in UUO model.

-
ALonp1 expression from online human RNA sequencing data (Data ref: Yi‐An, 2014). N = 20 in Ctl group an n = 19 in CKD group (biological replicates).
-
BLonp1 expression from online mouse UUO model RNA sequencing data (Data ref: Denby et al, 2020). N = 4 in each group (biological replicates).
-
CThe mRNA expression of Lonp1 in our UUO models (n = 5–7, biological replicates).
-
DLonp1 expression from kidney single cell datasets Gene Atlas of Reversible Unilateral Ureteric Obstruction Model (http://www.ruuo‐kidney‐gene‐atlas.com/).
-
E, FPearson correlation analysis of LONP1 and BUN and Serum Creatinine in CKD patients (n = 30).
-
GWestern blot and densitometric analysis for the expression of LONP1 of proximal tubular cells isolated from WT and cKI mice (n = 3, biological replicates).
-
H, IqRT‐PCR analysis of mitochondrial genes in WT and cKI mice after UUO (n = 8 in each group, biological replicates).
-
JTransmission electron microscopy images of intact renal tubule cells and mitochondria in WT and cKI mice after UUO. Scale bar: 5 μm, 2 μm and 500 nm.
Data information: Data are presented as mean ± SEM. Student's t‐test. In the boxplot of B, the central band represents the median line; the boxes represent range between 25 and 75%; the whiskers represent range within the 1.5 IQR (Inter‐Quartile Range).
Source data are available online for this figure.
