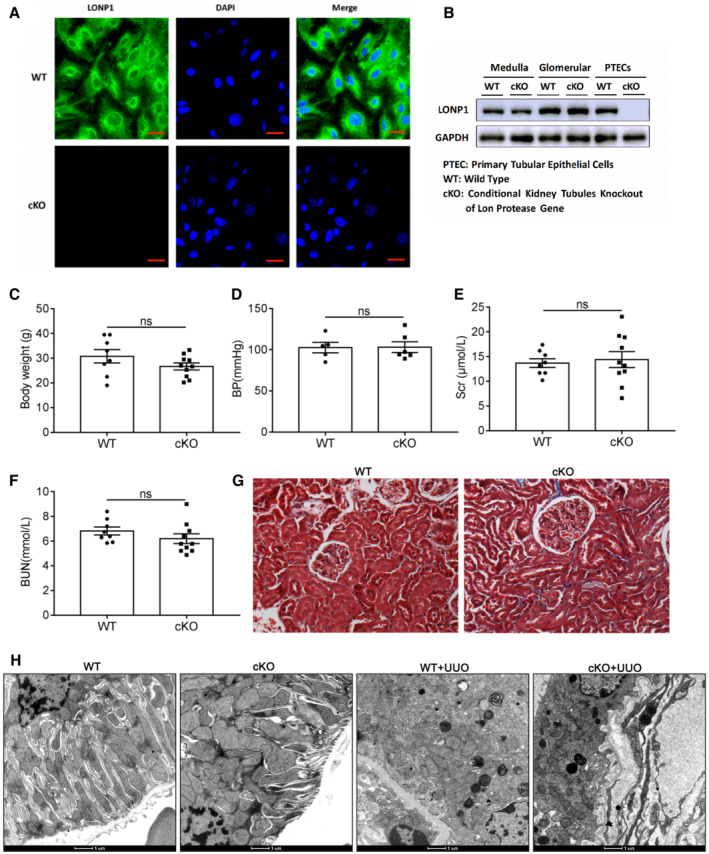
Figure EV2. Validation of proximal tubular‐specific deletion of Lonp1 (cKO), physiological indexes of aged cKO mice, and mitochondrial morphology in UUO model.

-
ALONP1 immunofluorescence staining of primary renal tubular epithelial cells (PTECs) isolated from WT and cKO mice. Scale bar: 20 μm.
-
BWestern blot analysis for the expression of LONP1 in medulla, glomerular and PTECs.
-
C–GBody weight (n = 8 or 10), blood pressure (BP, n = 5 or 6), serum creatinine (Scr, n = 8 or 10), blood urea nitrogen (BUN, n = 8 or 10) and Masson's trichrome staining in elderly WT and cKO mice (18 months). Scale bar: 50 μm.
-
HTransmission electron microscopy images of the mitochondria in tubular cells in WT and cKO mice after UUO model. Scale bar: 1 μm.
Data information: Data are presented as mean ± SEM. Student's t‐test.
Source data are available online for this figure.
