
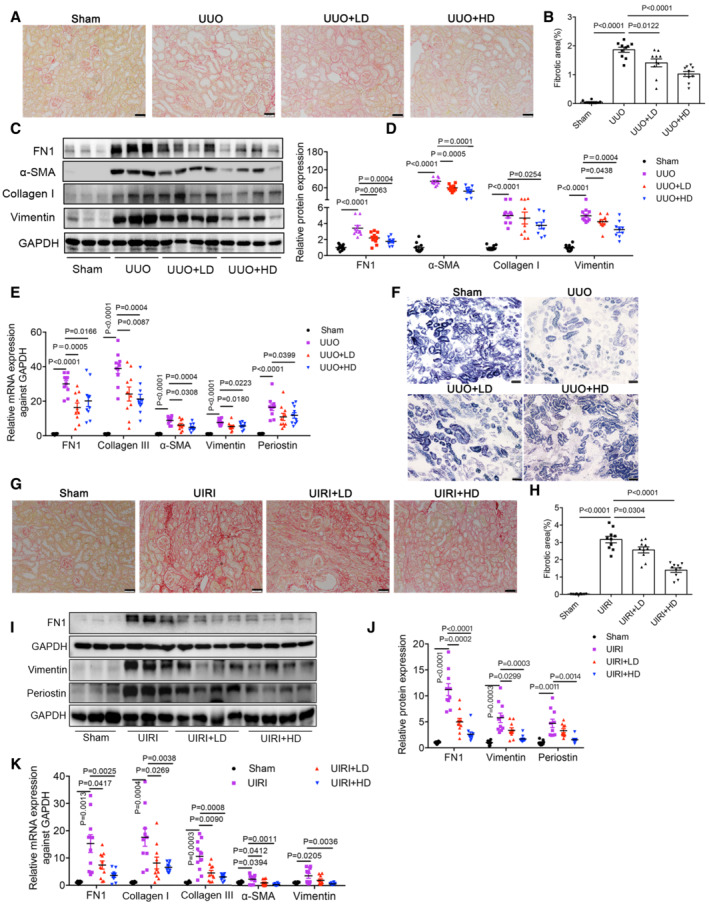
Figure 8. Anti‐renal fibrosis and maintenance of mitochondrial function of LONP1 activator in UUO and UIRI models.
-
AFibrosis deposition of kidney tissues was determined by Sirius red staining in UUO model. Scale bar: 50 μm.
-
BQuantification of fibrotic area in UUO model (n = 10 in each group, biological replicates).
-
C, DRepresentative Western blot images and densitometric analysis of FN1, Collagen I, α‐SMA and Vimentin protein levels in kidney tissues of UUO model (n = 9–10 in each group, biological replicates).
-
EqRT‐PCR analysis of FN1, Collagen III, α‐SMA, Vimentin and Periostin mRNA levels in kidney tissues of UUO different groups (n = 10 in each group, biological replicates).
-
FRepresentative images of succinate dehydrogenase (SDH) staining in UUO model. Scale bar: 50 μm.
-
G, HFibrosis deposition of kidney tissues was determined by Sirius red staining and quantified in UIRI model (n = 10 in each group, biological replicates). Scale bar: 50 μm.
-
I, JWestern blot and densitometric analysis of FN1, Vimentin and Periostin protein levels in kidney tissues of UIRI model (n = 8–10 in each group, biological replicates).
-
KqRT‐PCR analysis of FN1, Collagen I, Collagen III, α‐SMA and Vimentin mRNA levels in kidney tissues of UIRI different groups (n = 8–10 in each group, biological replicates).
Data information: Data are presented as mean ± SEM. Student's t‐test.
Source data are available online for this figure.