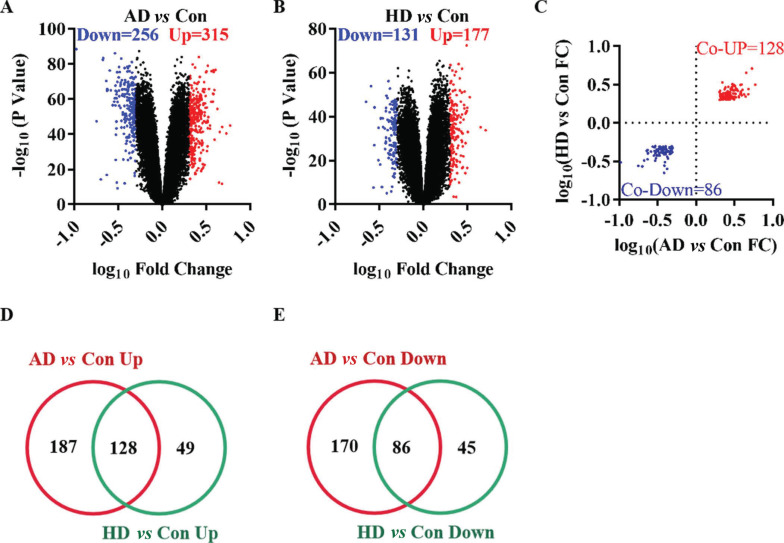
Fig. (1).
The differentially expressed genes in Alzheimer's disease and Huntington's disease. (A) The volcano plot of AD group compared with control group. (B) The volcano plot of HD group compared with control group. (C) The fold change of co-GEGs. (D) The Veen diagram of up-regulated genes. (E) The Veen diagram of down-regulated genes.
Abbreviations: AD: Alzheimer's disease group. HD: Huntington's disease group. Con: control group. FC: fold change.

