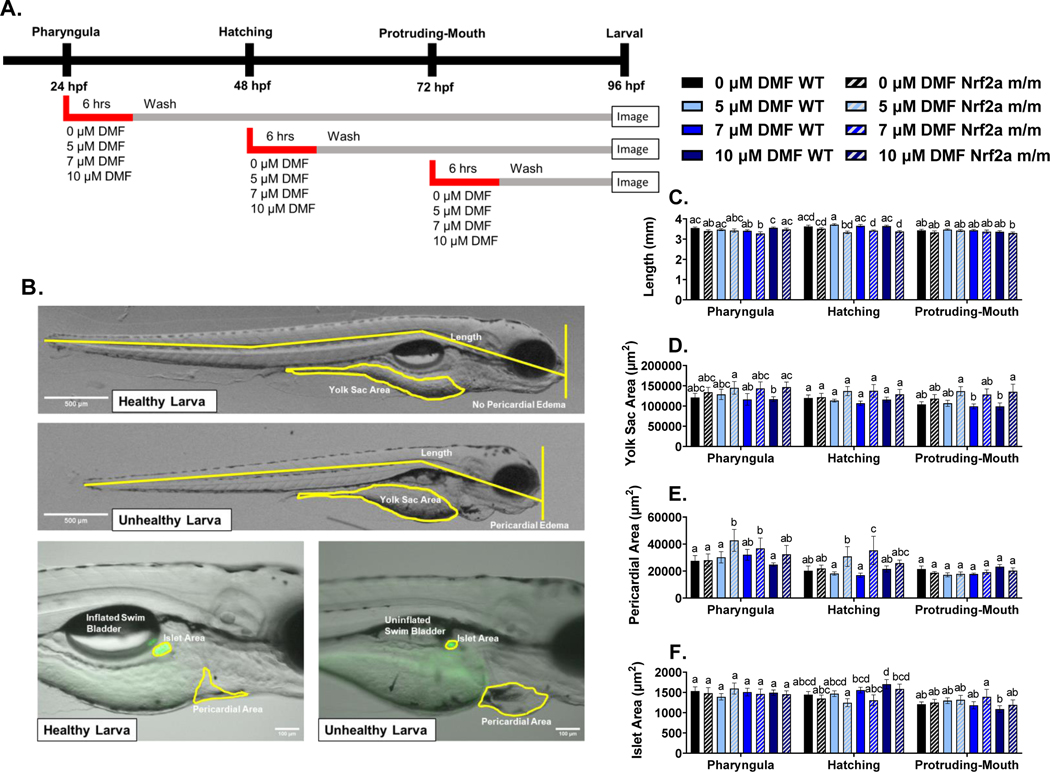
Fig. 2.
A) Treatment paradigm for morphology studies. B) Representative images for 20x (top) and 100x images (bottom) of healthy and unhealthy larva. Yellow lines represent measurements and Ins:GFP is shown in green in 100x images. Mean ±SEM of C) larval length, D) yolk sac area, E) pericardial area, and F) islet area is shown via treatment, genotype, and exposure stage. Calculations were performed using a two-way ANOVA followed by Fisher’s LSD post-hoc test. N = 11–32 fish from 2 or 3 independent experiments. Different letters indicate significant differences (p ≤ 0.05) between treatment and genotype within each development stage.

