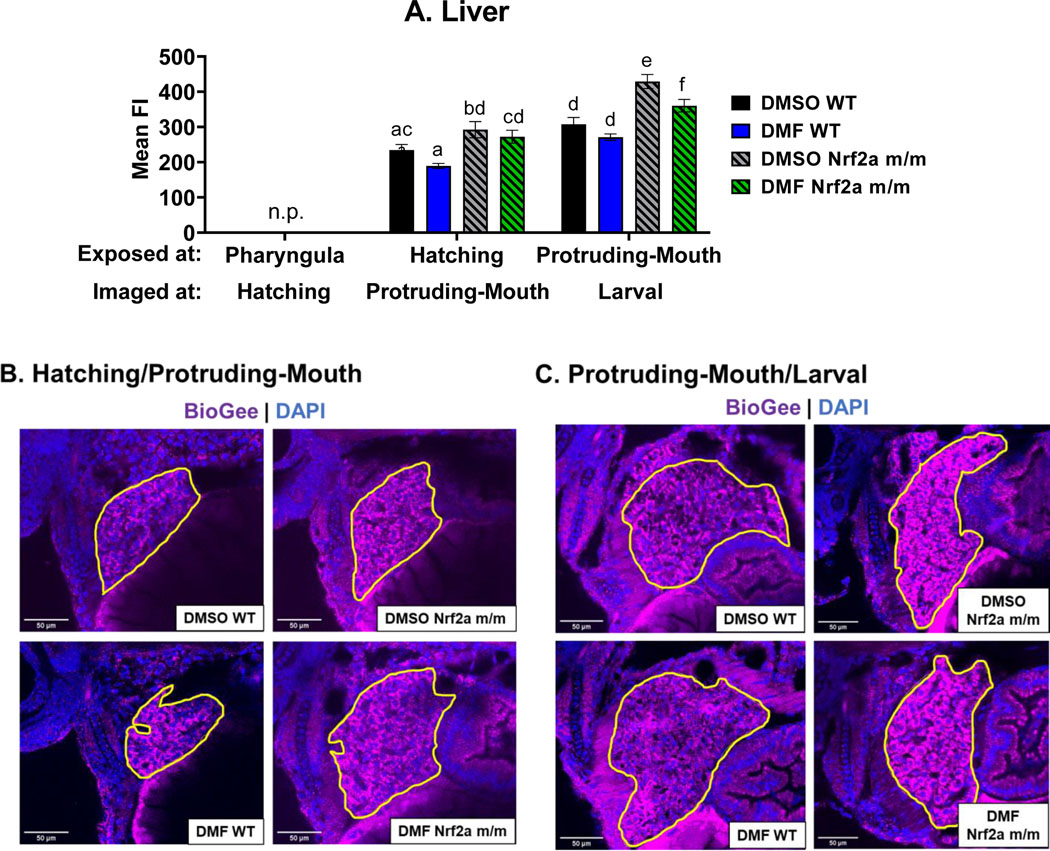
Fig. 9.

Zebrafish were treated with 7 μM DMF during hatching and protruding-mouth stage for 6 hours, and then embryos were treated with BioGee for 2 hrs before fixation 24 hours after treatment, and BioGee protein conjugates were labeled in situ. Images of the liver were taken using a confocal microscope under a 40x objective. A) Liver mean fluorescence intensity (FI) of Nrf2a protein was determined via image analysis. Representative images of the zebrafish liver treated during the B) hatching and C) protruding-mouth stage are shown where the liver is circled in yellow, where FITC (green) represents the beta cells, TRITC (purple) represents BioGee protein conjugates, and DAPI (blue) represents. n.p. indicates timepoints when liver was not present. Calculations were performed using a one-way ANOVA followed by Fisher’s LSD post-hoc test. N = 6–12 fish. Different letters indicate significant differences (p ≤ 0.05) between treatment, genotype, and time point.
