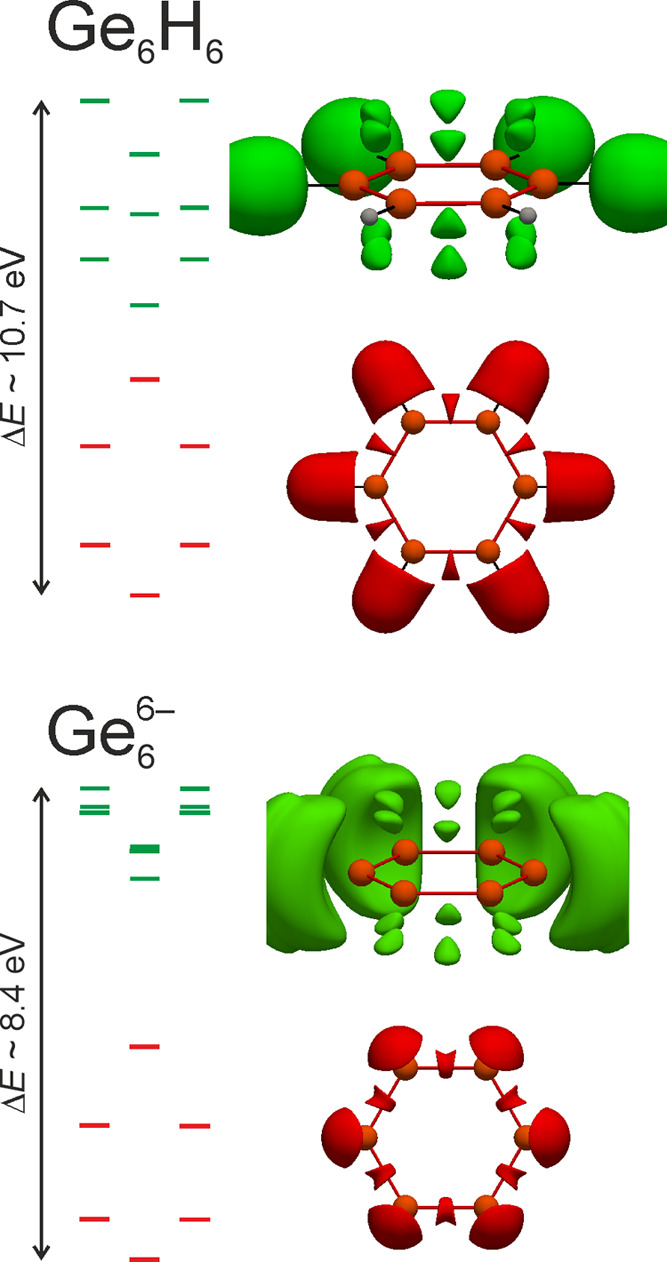
Figure 11.

Molecular orbital energy diagrams of Ge6H6 (top) and Ge66– (bottom), together with pELI contributions. In the two figures representing pELI contributions derived from the highest energy orbitals (green), two domains in the exocyclic regions have been deleted to enable a better view for the reader.
