. 2022 Dec 28;14(6):1613–1626. doi: 10.1039/d2sc06578a

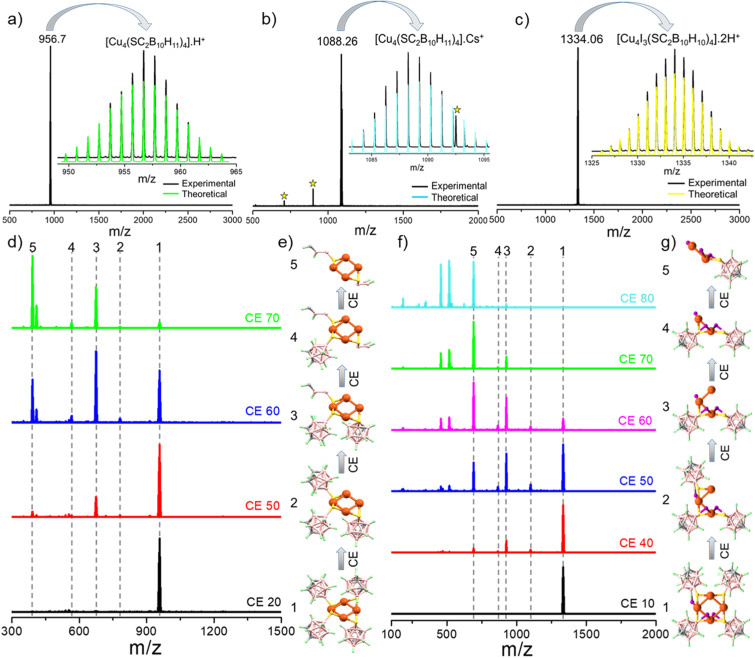
Fig. 3. Positive ion-mode ESI-mass spectra of (a) Cu4@oCBT, (b) Cu4@mCBT and (c) Cu4@ICBT. Formic acid and cesium acetate were used for the measurements as ionization enhancers. Insets show the matching of the experimental and theoretical spectra, respectively. Peaks labeled * are due to Cs+ ion impurity. (d) Collision energy dependent fragmentation of the molecular ion peak at m/z 956.35 of Cu4@oCBT shows the losses of different carborane thiol fragments without opening the Cu4 core. (e) Schematic representation showing the respective fragmentations. (f) Collision energy dependent fragmentation of the molecular ion peak at m/z 1334.06 of Cu4@ICBT shows the losses of carborane thiol fragments along with the opening of the Cu4 core. (g) Schematic representation showing the losses of different fragments of Cu4@ICBT. Color code: orange = copper, yellow = sulfur, pink = boron, violet = iodine, gray = carbon and green = hydrogen.

Fig. 3