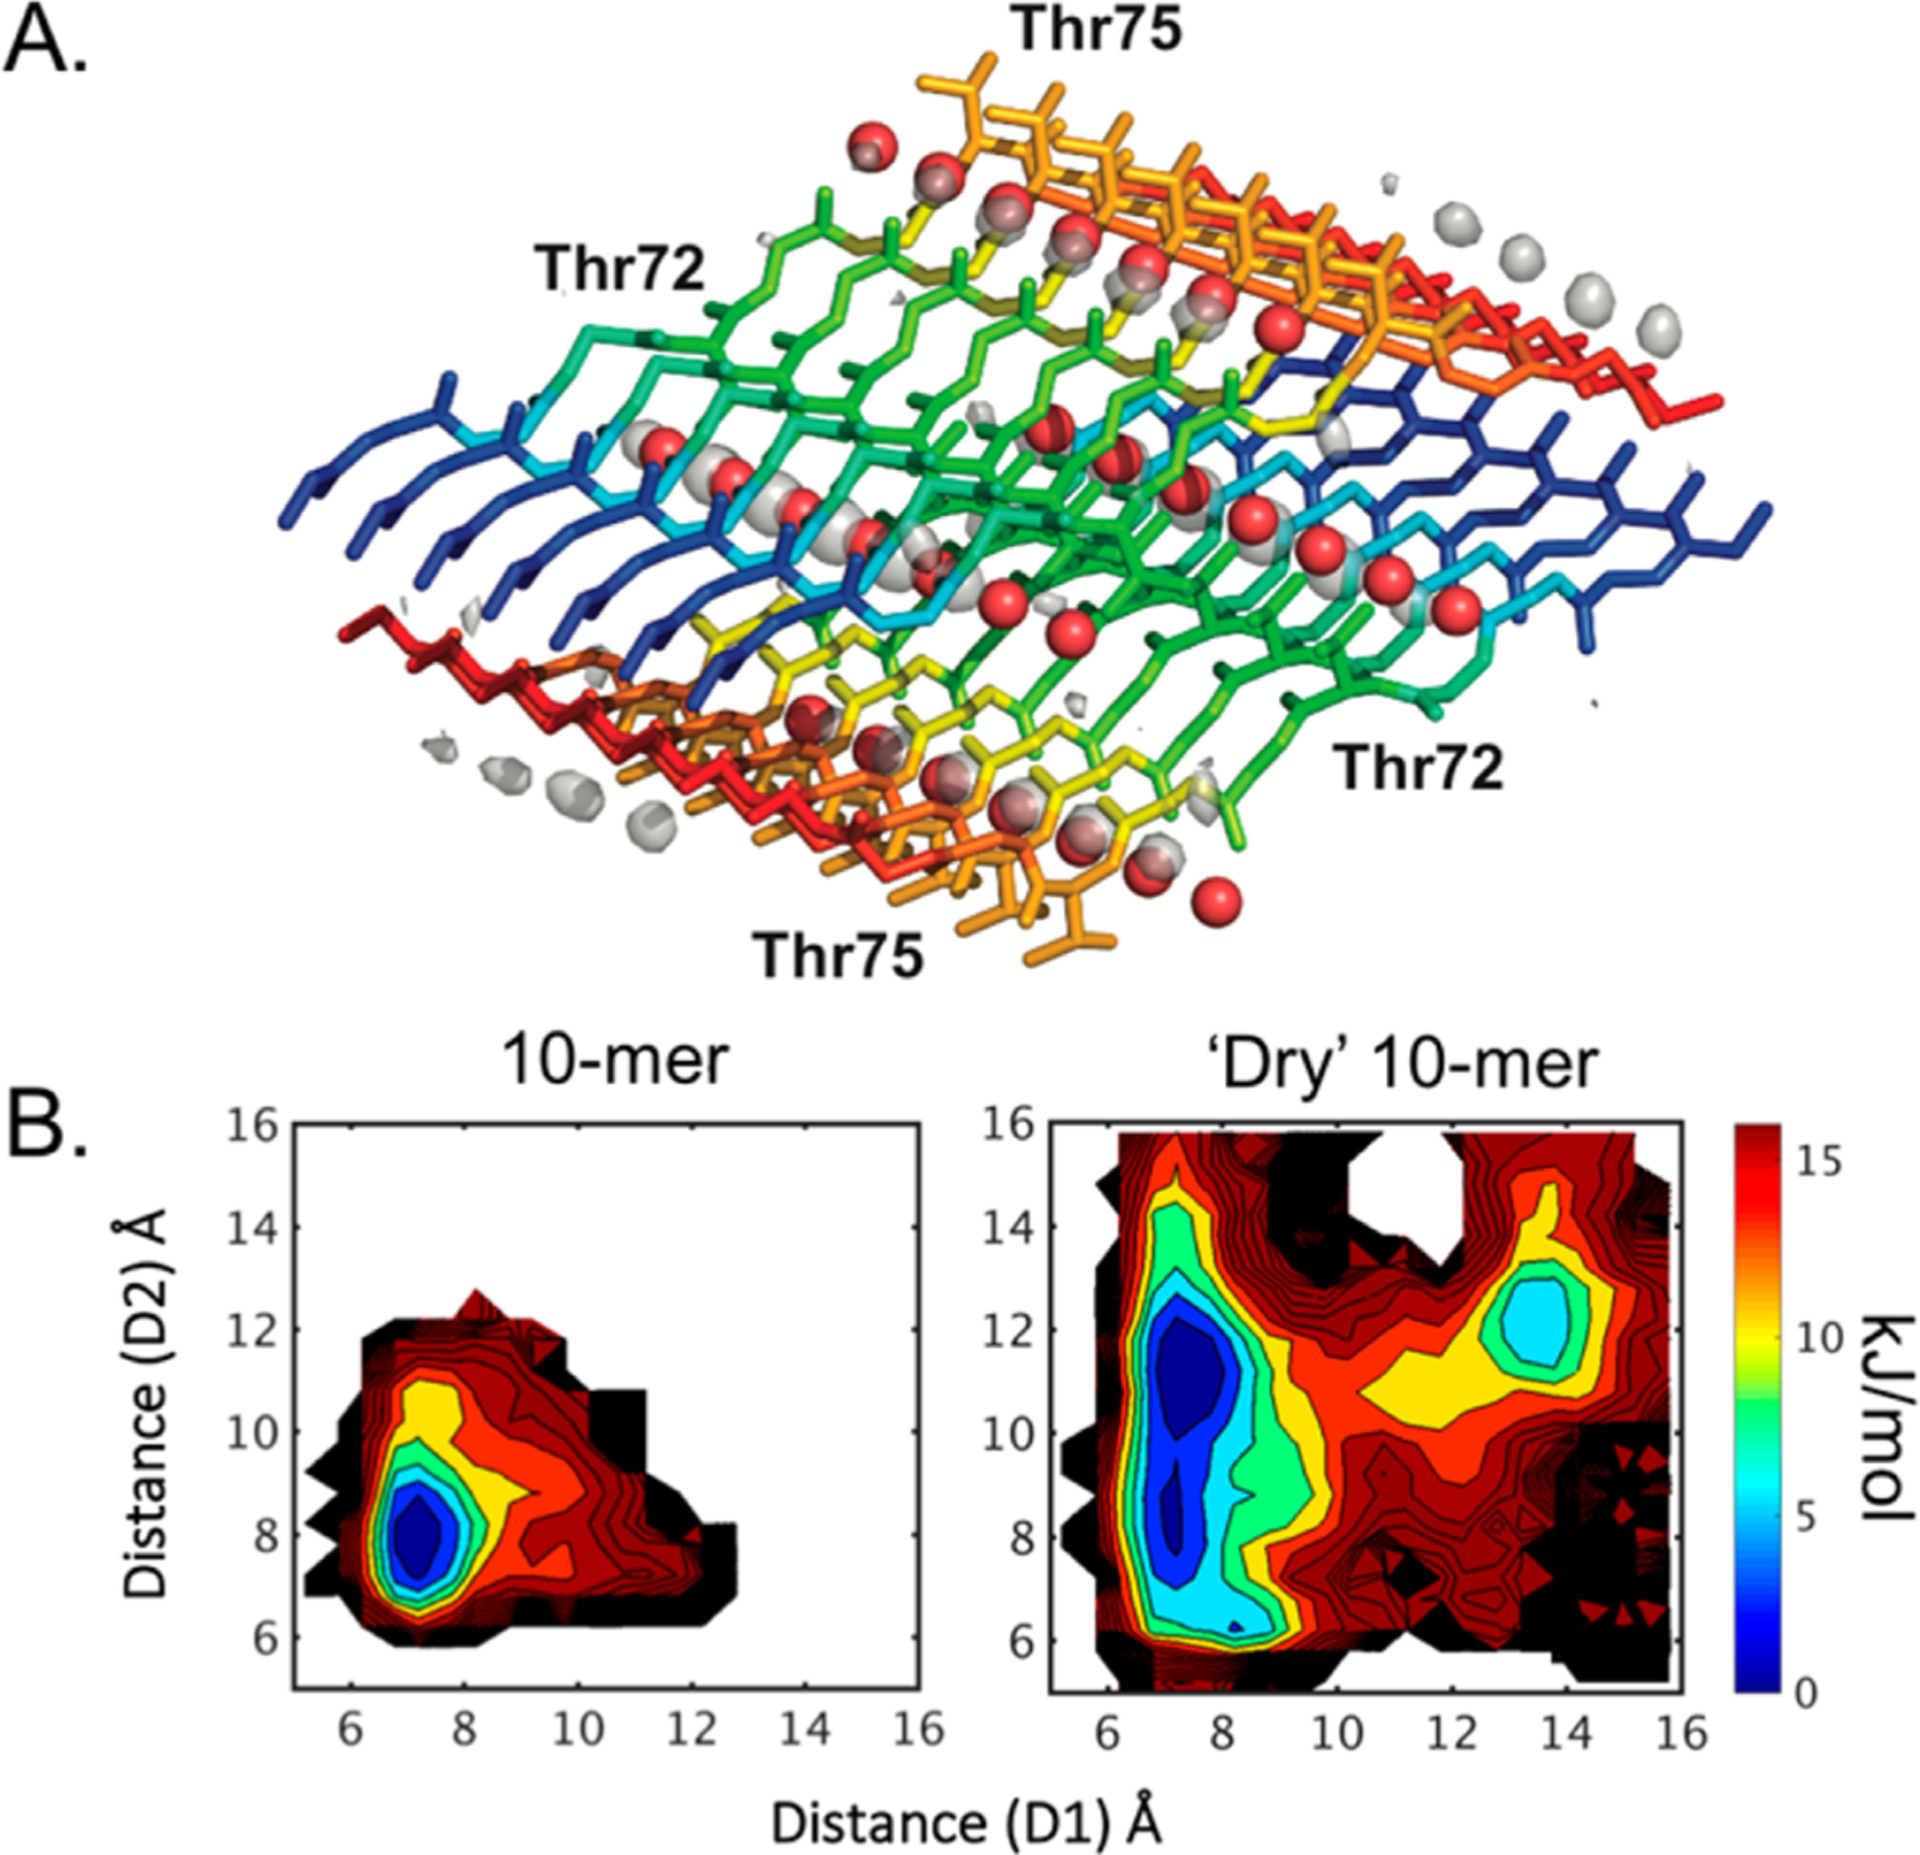
Figure 3.

(A) Water occupancy in a 7-dimer (14-mer) simulation, contoured at twice the bulk solvent density. The backbone color corresponds to the index along the chain for each monomer (e.g., blue for the first glycine to red for the final alanine). The crystal waters are shown as red spheres. The differences in positions are due to the average MD structure not exactly matching the crystal structure. (B) REMD free energy estimate from MBAR analysis for the 10-mer fibril, simulated with (left) and without (right, “Dry”) crystal waters.
