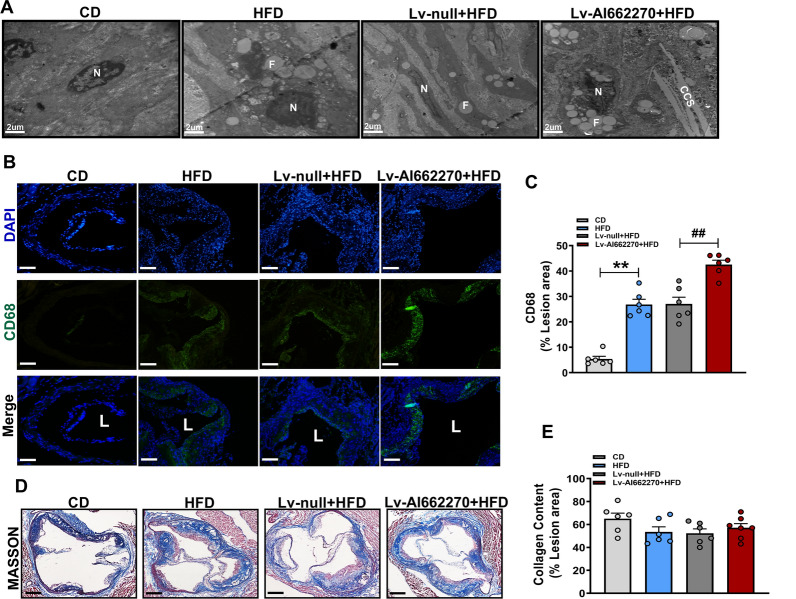
Fig. 4.
Effect of AI662270 on formation of foam cells, macrophages, and collagen content. A Foam cells was enriched in lesion (Scale bar = 2 μm, n = 3 mice). “N” represents nuclei; “F” represents foam cells; “CCS” represents cholesterol crystals. B, C The macrophage content was denoted by probing with CD68 (Scale bar = 20 μm, n = 6 mice), “L” represents lumen. D, E Collagen content was analyzed via MASSON staining (Scale bar = 400 μm, n = 6 mice); **p < 0.01 vs. mice in CD, ##p < 0.01 vs. Lv-null treated mice in HFD. Data are expressed as mean ± SEM

