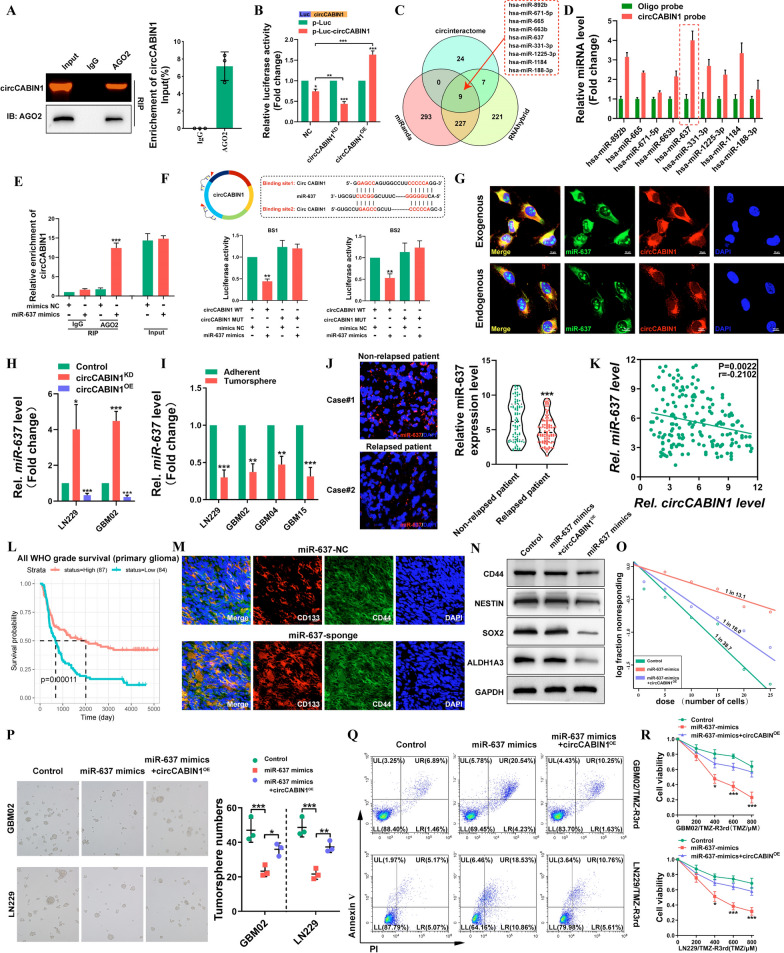
Fig. 5.
circCABIN1 acted as a sponge of miR-637 in GBM. A RIP assay verified AGO2 binding with circCABIN1. B A luciferase reporter assay was conducted to measure the luciferase activity of p-luc circASAP1 in HEK-293 T cells cotransfected with the circCABIN1KD or circCABIN1OE. C The venn diagram showed that 9 miRNAs were changed together in three groups. D Pull down and qRT-PCR assay verified 9 miRNA binding with circCABIN1 probe. E RIP assay verified miR-637 binding with AGO2. F Schematic diagram of the circCABIN1 and miR-637 binding sites and luciferase reporter assay verified circCABIN1 binding with miR-637 mimics. G The co-localization of circCABIN1 (red) and exogenous / endogenous miR-637 (green) in LN229 cells using fluorescence in situ hybridization (FISH). Nuclei were counterstained with DAPI (blue). Scale bar, 10 μm. H The expression of miR-637 in GBM cells were analyzed by qRT-PCR after knockdown or overexpression of circCABIN1. I The expression of miR-637 in TMZ-resistant and adherent cells by qRT-PCR. J The expression of miR-637 in relapsed or non-relapsed patients by fluorescence confocal and qRT-PCR. K Pearson correlation analysis of circCABIN1 and miR-637 (p = 0.0022). L Kaplan–Meier analysis of OS in the high and low miR-637 groups in CGGA (p = 0.00011). M Fluorescence images showed the expression of CD133 (red) and CD44 (green) of brain frozen section from orthotopic GBM xenograft mice in indicated groups. Nuclei were counterstained with DAPI (blue). Scale bar, 10 μm. N-P Western blot, limiting dilution analysis and tumorsphere formation assays detected the stem cell properties of cells transfected with control vector, miR-637 mimics alone or miR-637 mimics plus circCABIN1OE. Q-R GBM cells administrated with control vector, miR-637 mimics alone or miR-637 mimics plus circCABIN1OE were subjected to FACS and CCK-8 assays. Results are presented as mean ± SD. *p < 0.05, **p < 0.01 and ***p < 0.001

