
Figure 1.
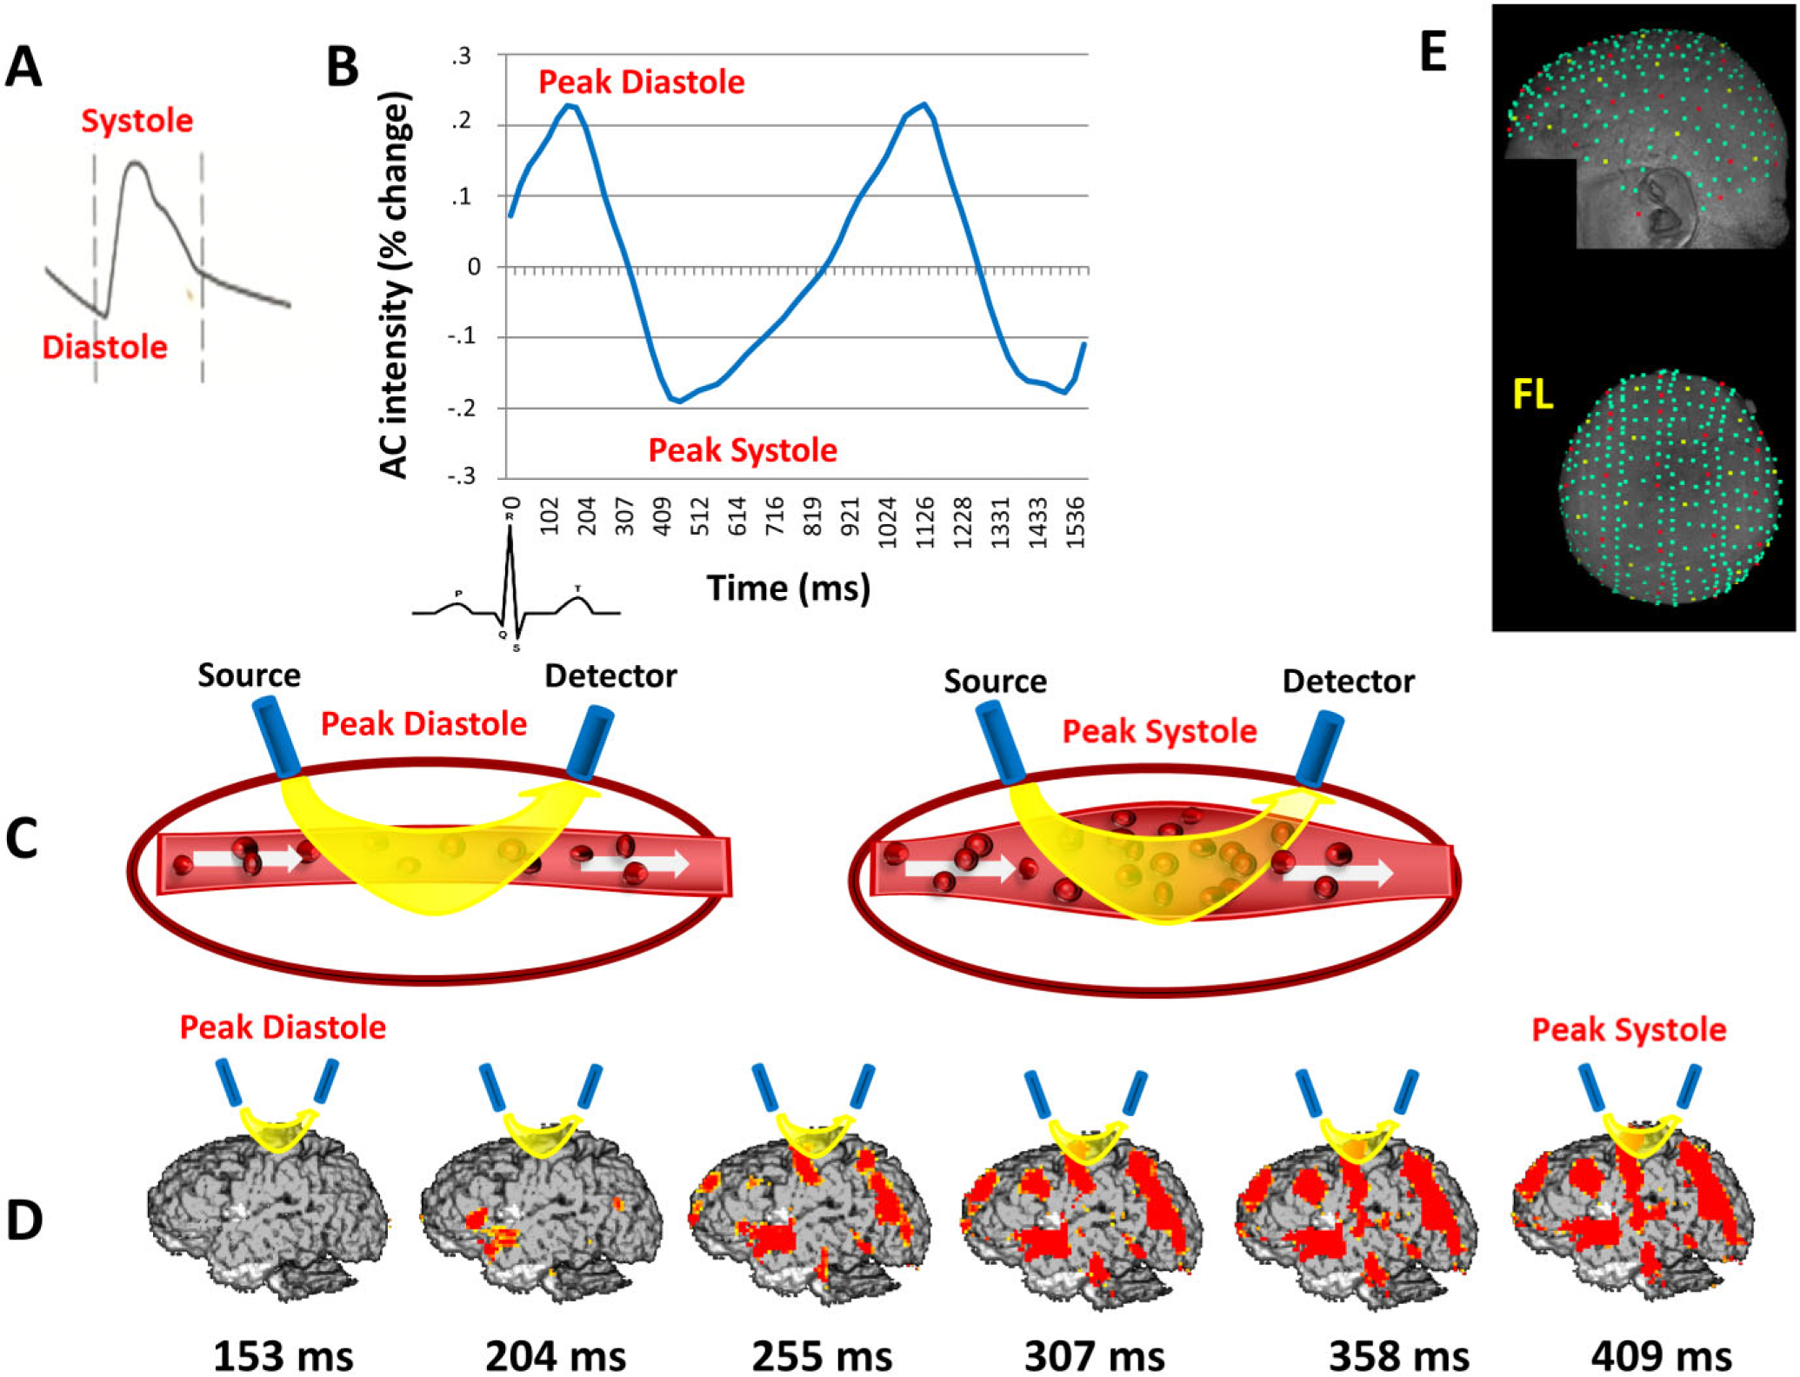
A: Typical pulse wave as measured at the carotid by ultrasound Doppler. B: Pulse wave measured optically as a change in the intensity of the AC light moving between a source and a detector located on the surface of the head. The peak of the systole corresponds to a minimum (and the peak of the diastole to a maximum) in the amount of light detected after traveling through the tissue. C: Schematic depiction of changes in arterial diameter and oxyhemoglobin content during a pulse cycle, causing the changes in light intensity shown in (B), as more light is absorbed during the systole. D: Images of the pulse in the brain over time averaged across participants. Images are based on changes from the diastolic peak value (on average 153 ms after R wave onset). The systolic peak (on average 409 ms after R wave onset) shows the maximum change with respect to the diastolic peak value. At this point, the large arteries are most visible. E: Distribution of the sources (in yellow) and detectors (in red) used for data collection over the MR-rendered scalp of a representative participant. Other digitized locations used for coregistration with the structural MRI recordings are shown in green. FL = front left.