
Figure 2.
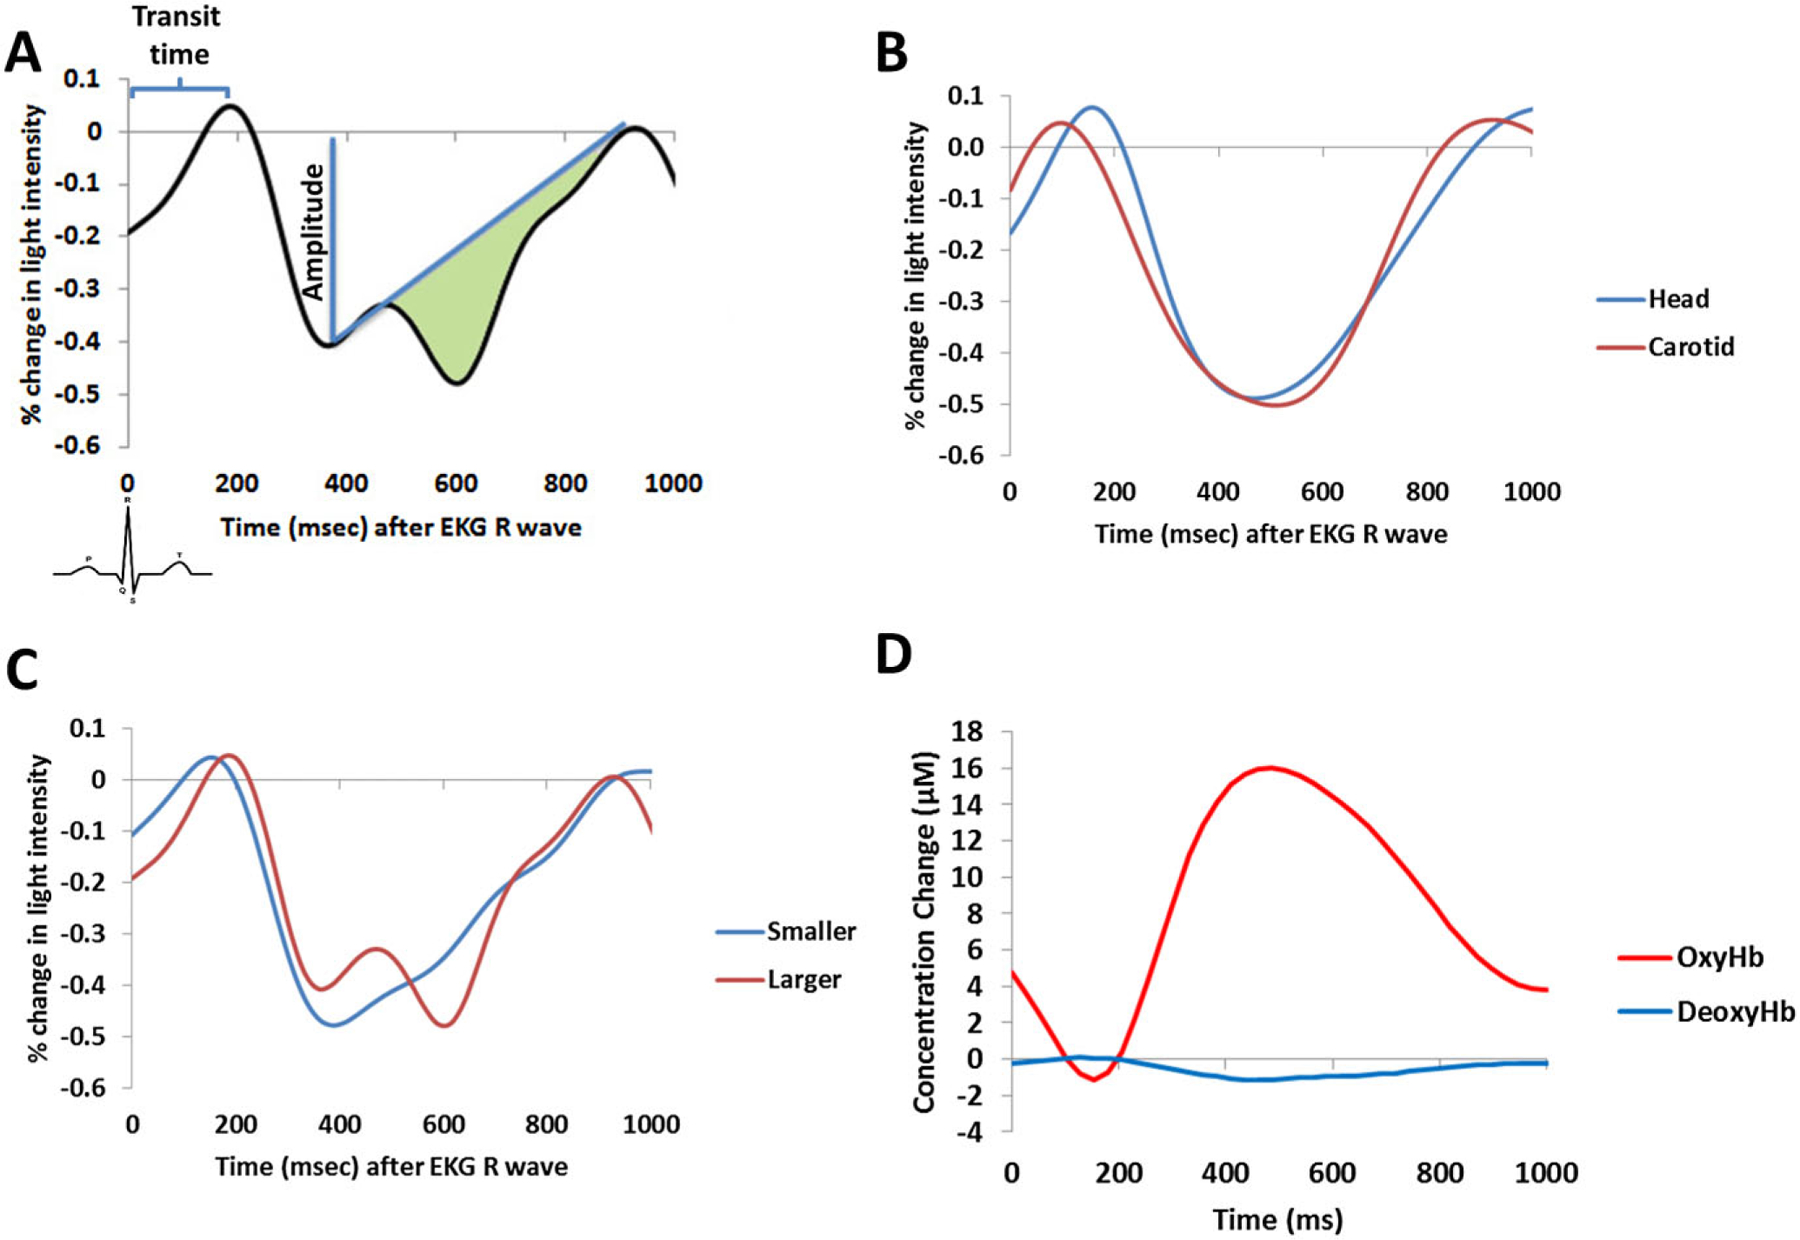
A: Schematic depiction of the approaches used for pulse amplitude, transit time, and arterial compliance/elasticity measurements. The green area represents the estimated compliance/elasticity. B: Average pulse waveforms at the head and carotid. C: Cerebral pulse waveforms in two participants chosen for having a smaller or larger compliance. D: Average pulse waveform decomposed into its oxy- and deoxyhemoglobin contributions.