
Figure 5.
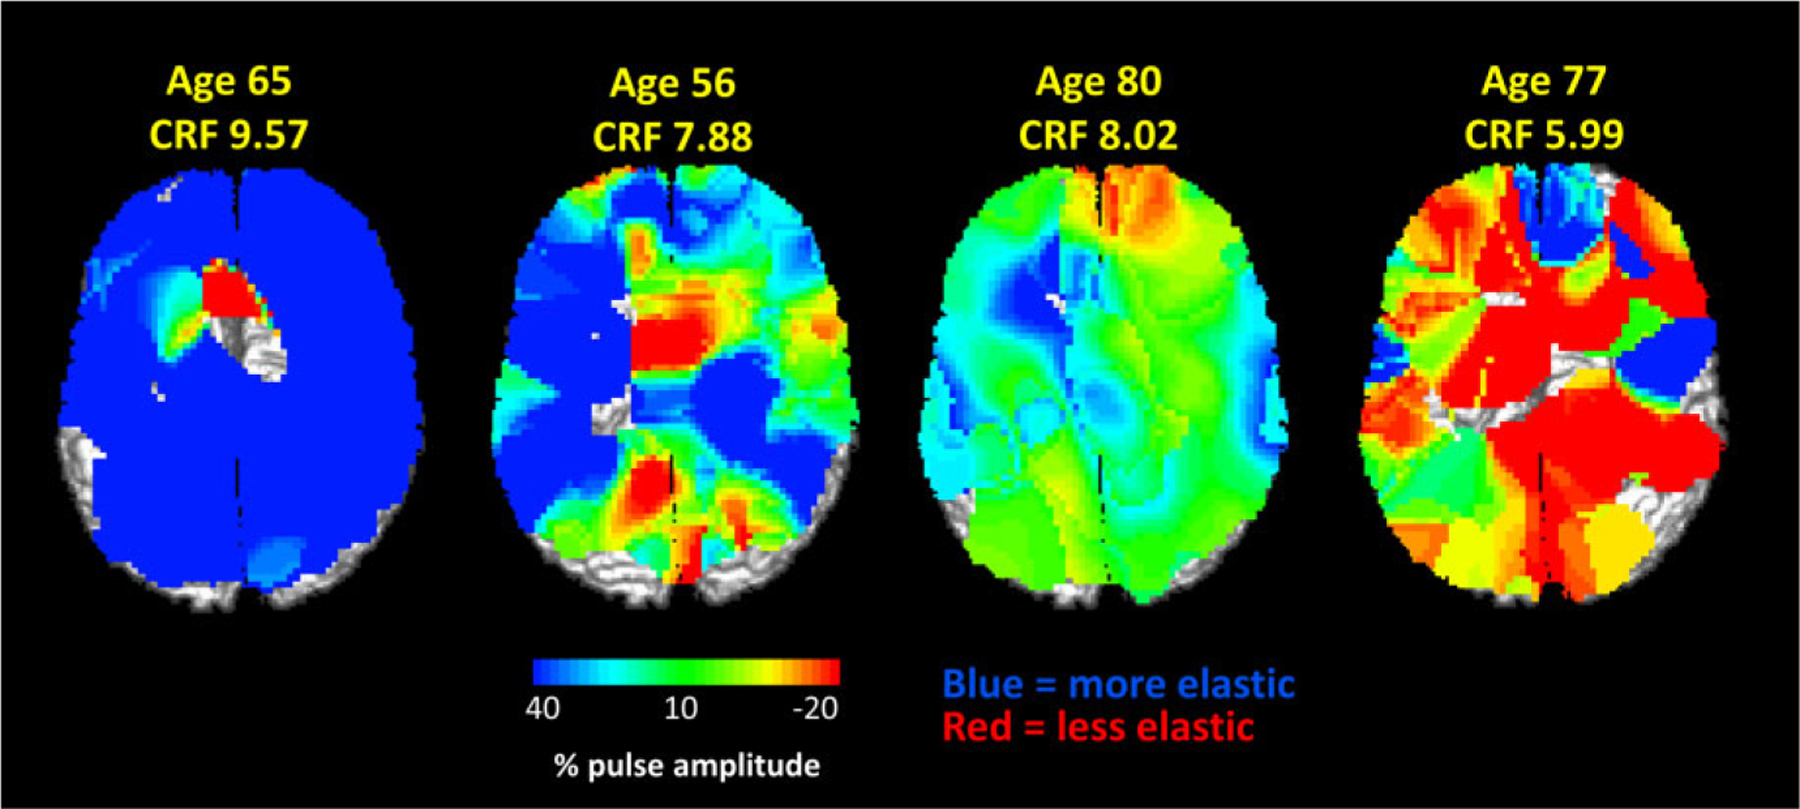
Maps of the relative amplitude of the arterial compliance estimate, normalized by the peak of the systolic pulse, in four participants varying in age and CRF. Values in blue indicate greater compliance (corresponding to more elastic arteries), values in green and red indicate smaller compliance (corresponding to stiffer arteries). Higher CRF estimates indicate higher levels of fitness (adjusted for gender). Note the generally lower compliance in older and less fit individuals.