
Figure 8.
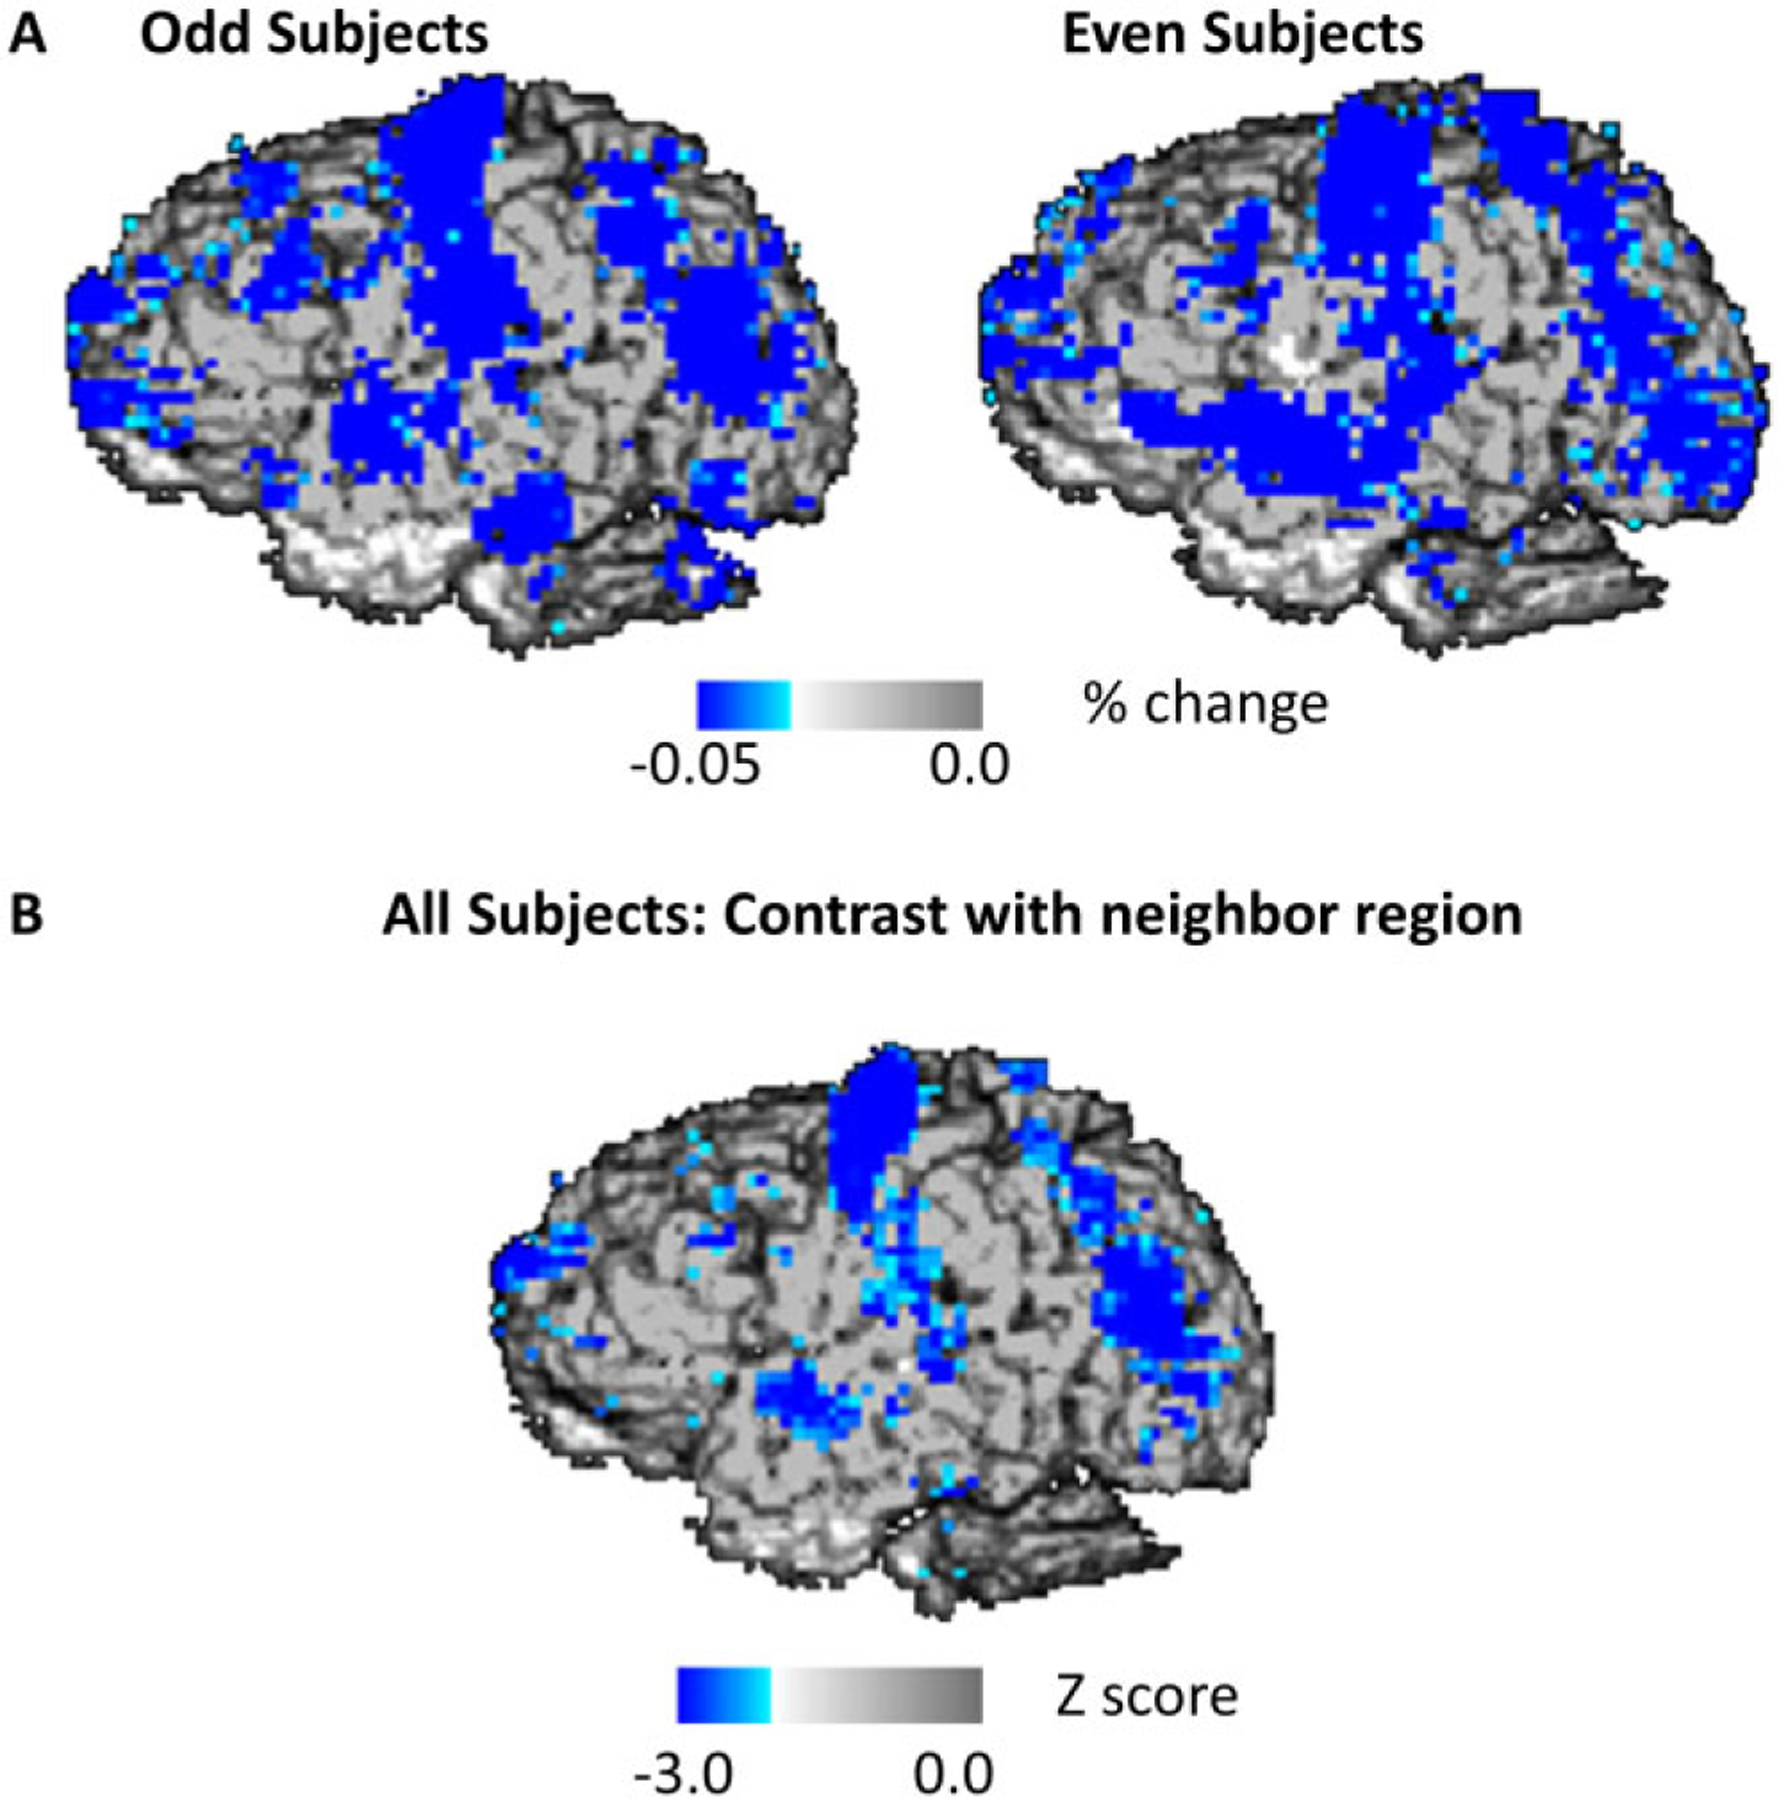
A: Average optical pulsogram based on AC intensity values, averaged across odd and even participants. B: Z-score map obtained across participants, representing the difference between a voxel and the surrounding region. Values in blue indicate those voxels in which the amplitude of the pulse is consistently larger compared to the nearby voxels.