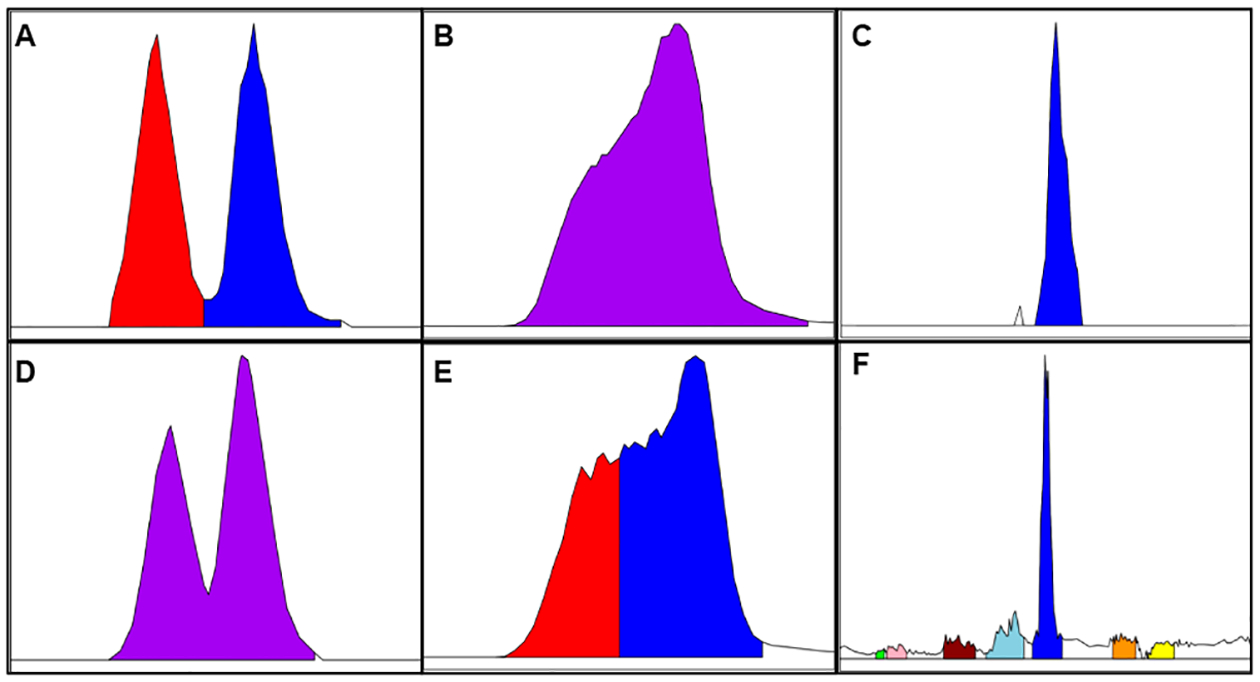
Figure 5.

Illustration of common processing errors. The top row (A–C) displays correctly integrated peaks, whereas the second row (D–F) displays errors. In (A), two isomers are integrated as separate peaks, but in (D), they are fused as one feature. In (B), a wide peak is integrated as one feature, but in (E), it is split into multiple features. In (C) and (E), one peak is matched to numerous low signal/noise features, with only the abundant peak representing the true compound match. Processing errors such as these complicate accurate 1–1 feature matching between data sets.
