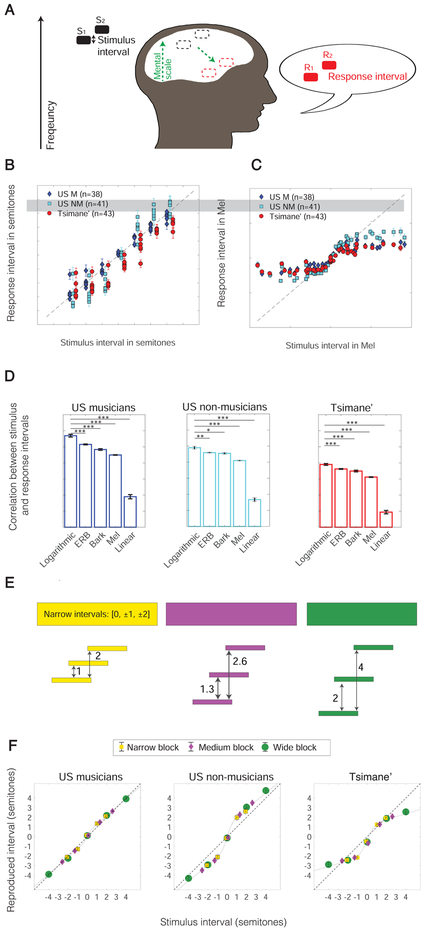
Figure 2. Log Frequency Scale is Present Cross-culturally.
A. Schematic of experiment design. Participants heard tones in one of eight different frequency registers and reproduced them in their singing range, presumably using an internal scale to map the stimulus interval onto their response interval. B. Stimulus and mean response intervals measured with a logarithmic scale, for US non-musician and Tsimane’ participants. Each data point plots the mean reproduced interval for a particular stimulus interval, stimulus register, and participant group. Error bars plot SEM across participants. C. Stimulus and mean response intervals measured with the Mel scale. D. Correlation between stimulus and response intervals when measured with five common scales. Asterisks denote statistically significant differences (*: p<.05; ***: p<.001). Error bars plot within-subject SEM across participants (see Figure S2 for scatter plots of the correlations for individual participants). E. Design of control experiment in which the range of stimulus intervals varied across three sections of the experiment. F. Stimulus and response intervals for the three groups, measured with a logarithmic scale. Every data point plots the mean reproduced interval for a particular stimulus interval in one of the three sections, averaged across registers to facilitate comparison between sections. The same stimulus interval generated similar response intervals across experiment sections with different ranges of intervals, indicating that listeners were not simply fitting the heard intervals into their comfortable singing range irrespective of their actual size. Curves denote parametric model fits to the data (a linear combination of sigmoid and a linear function).

