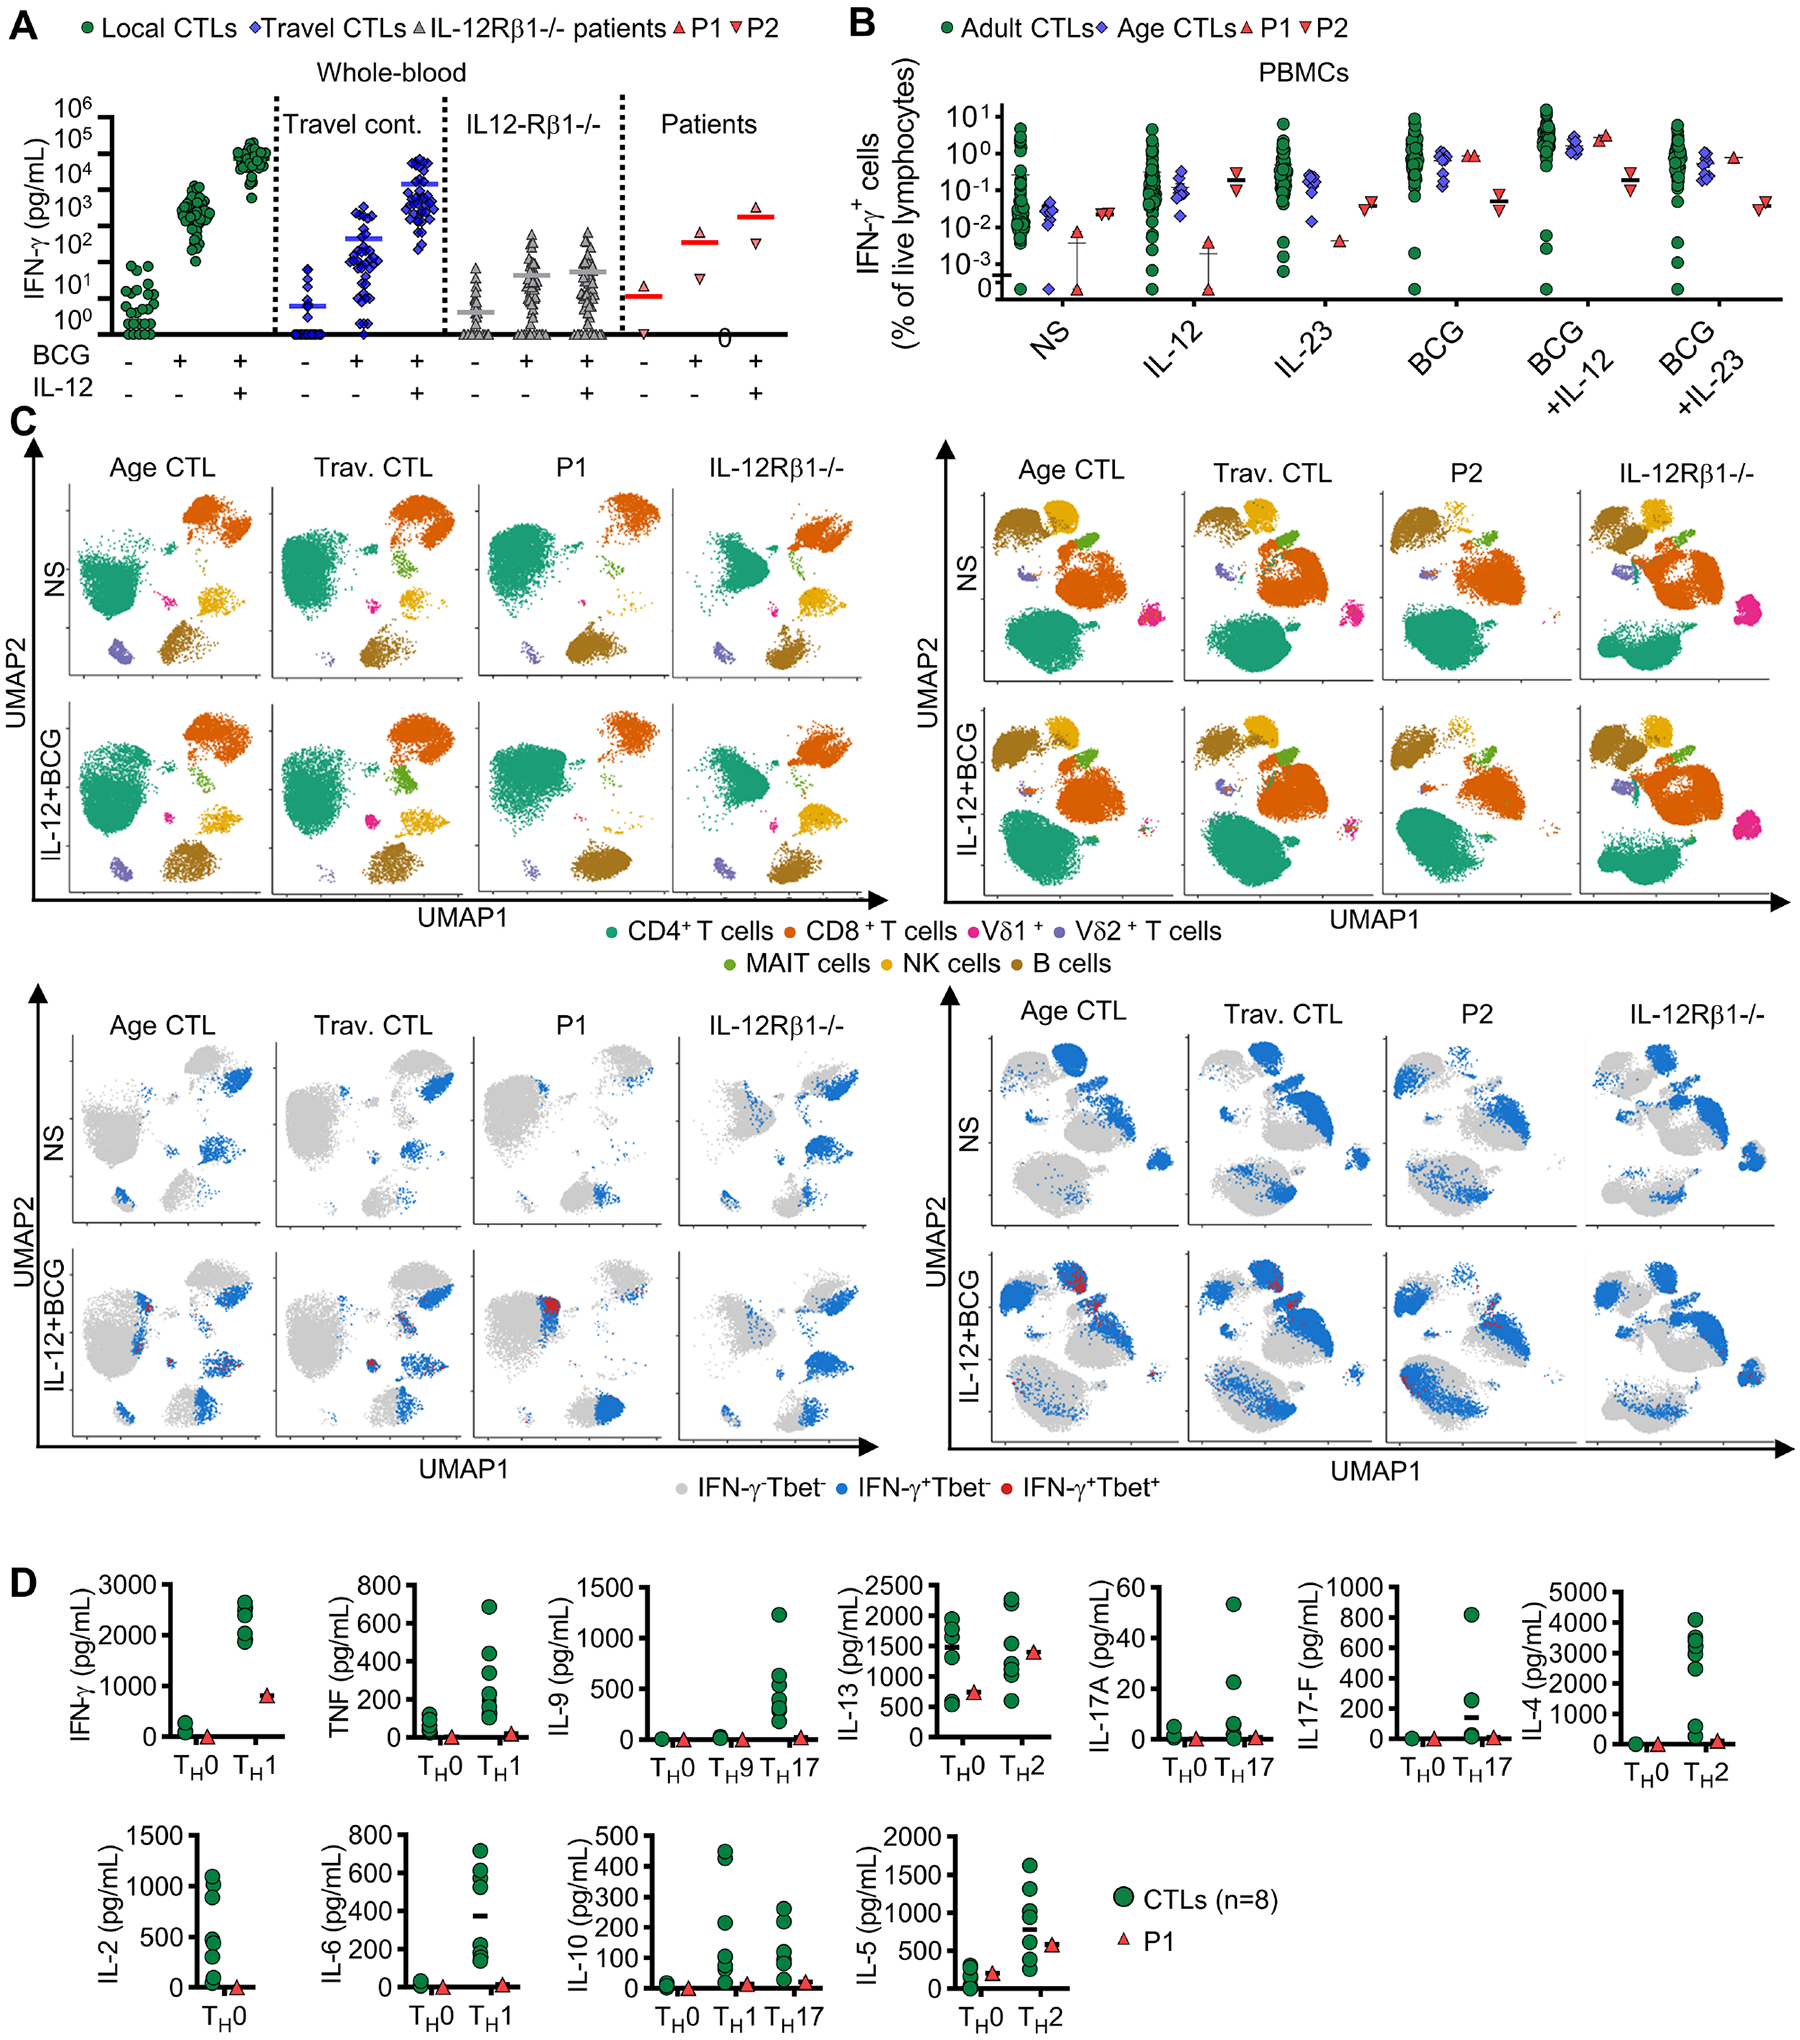
Figure 4 – Production of IFN-γ by the lymphoid cells of IRF1-deficient patients.

(A) Induction of IFN-γ secretion in a whole-blood assay, for controls (CTLs), IL-12Rβ1-deficient patients and patients. Bars represent the mean. (B) Intracellular flow cytometry on IFN-γ+ PBMCs after stimulation with IL-12, IL-23, or BCG. Bars represent the mean. Technical duplicates of the same experiment are shown for P1 and P2. (C) UMAP analysis of intracellular T-bet and IFN-γ expression by intracellular spectral flow cytometry across various PBMC subsets. Lymphoid subsets based on surface marker expression (upper panel), and their levels of IFN-γ and T-bet expression (lower panel). (D) Cytokine levels in the supernatant of naïve CD4+ T cells in polarizing conditions.
