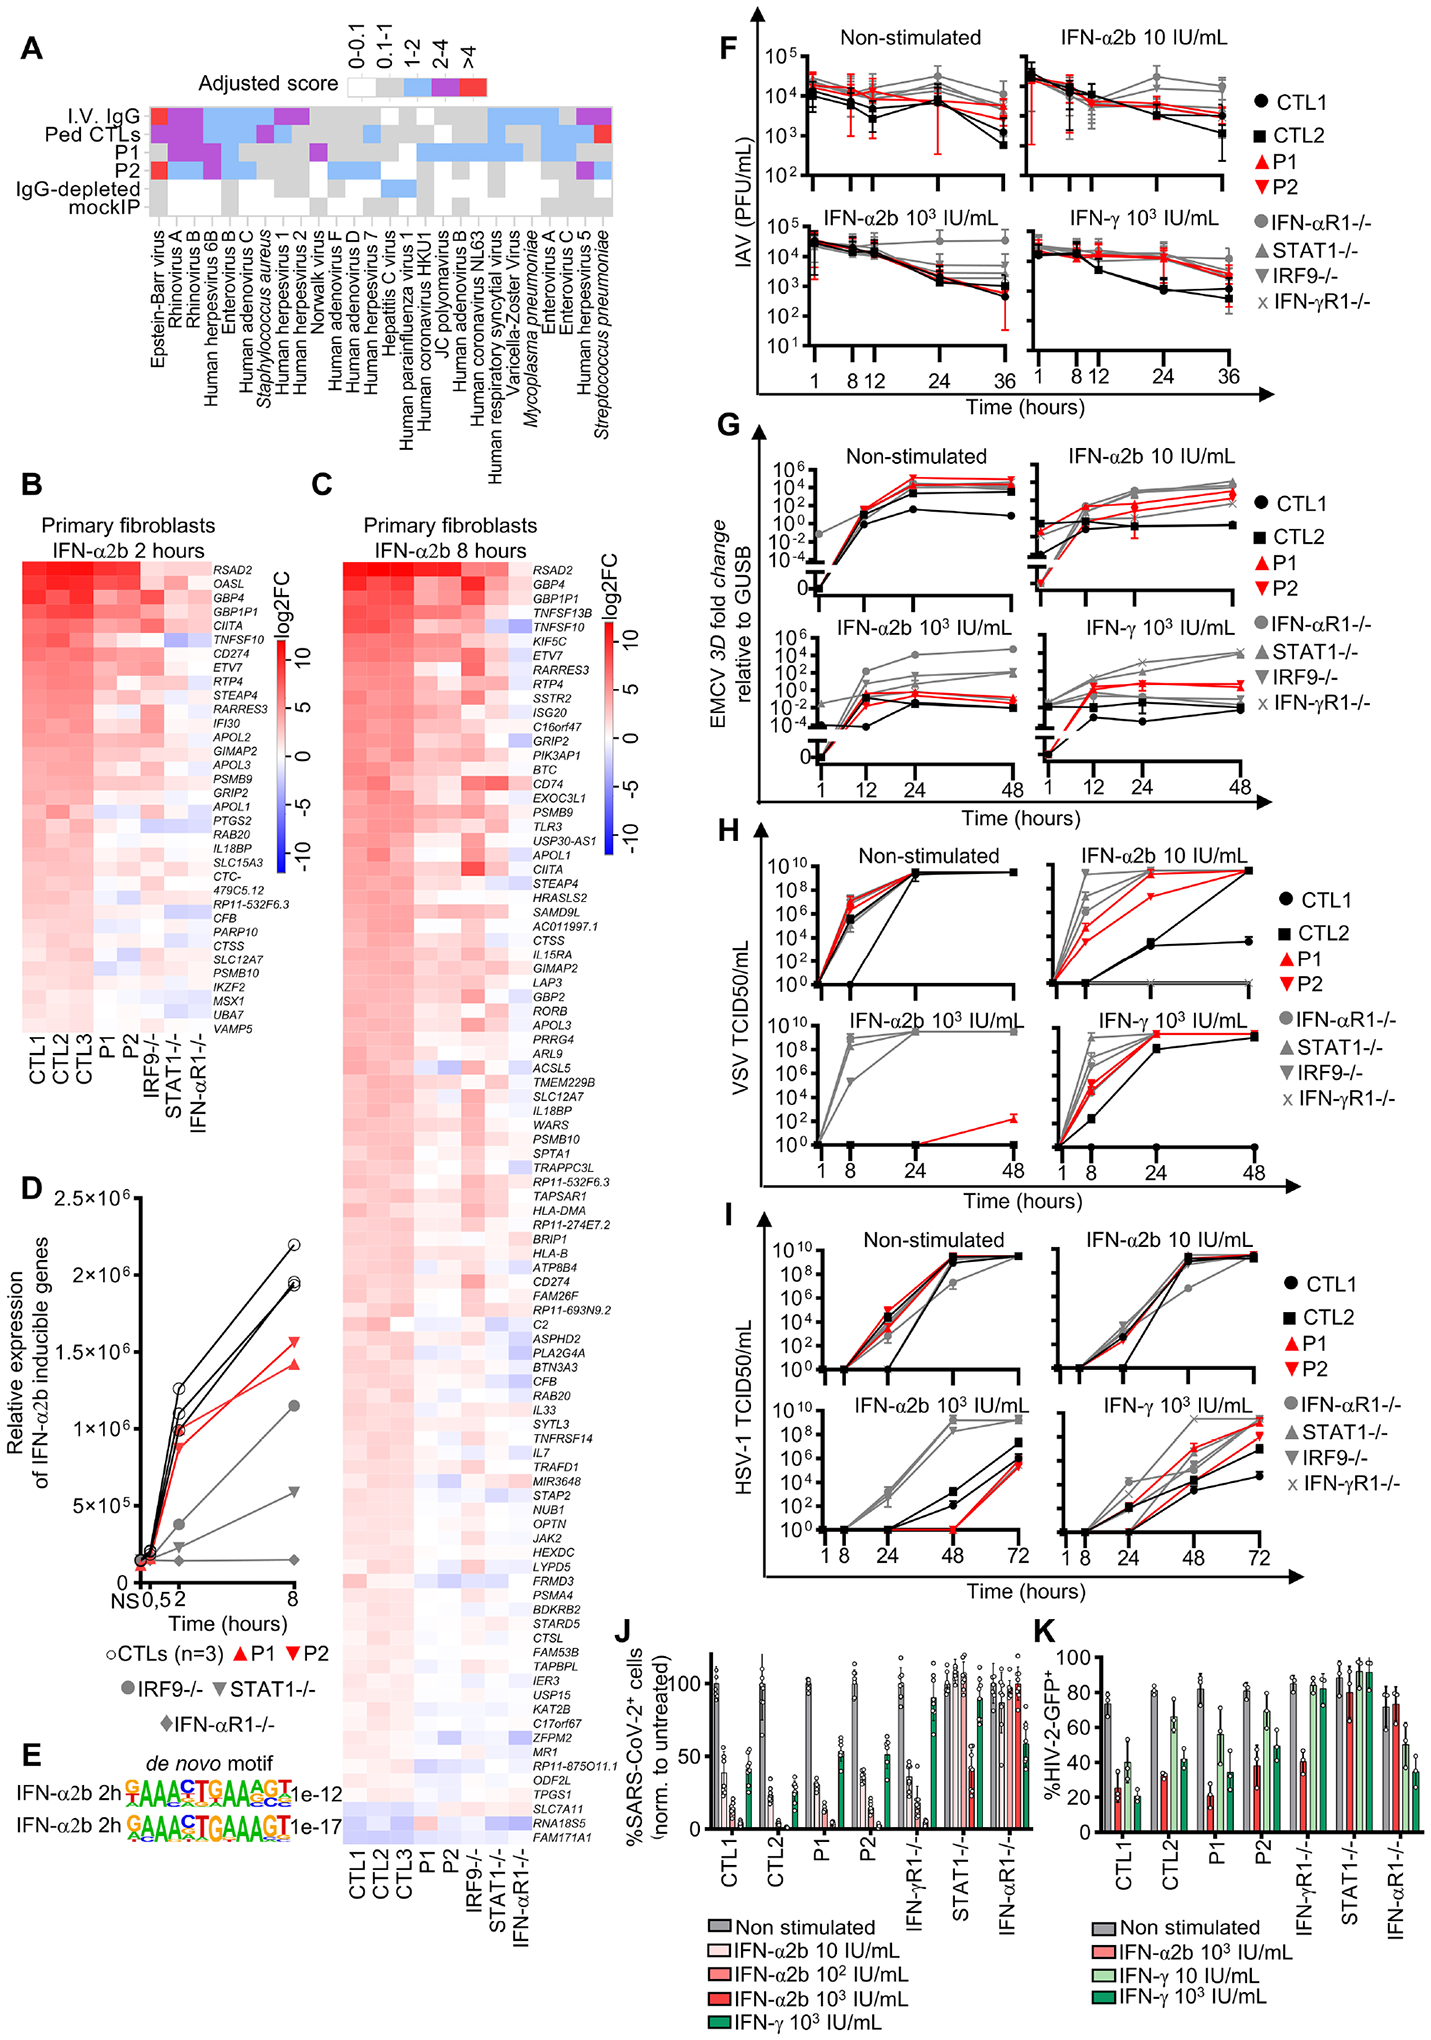
Figure 7 – IFN-α and IFN-γ-driven antiviral immunity in the cells of IRF1-deficient patients.

(A) Antiviral antibody responses to species for which at least one sample tested seropositive by PhIP-Seq. “IVIG” correspond to the mean response for samples from pooled patients on IVIGs and “pediatric CTLs” to pediatric controls. A hierarchical clustering of samples based on antiviral antibody levels is shown at the top. Heatmap showing genes differentially expressed (|log2(FC)| > 1 and adj. p-value < 0.05) in CTL cells after 2 hours (B) or 8 hours (C) of IFN-α2b stimulation, and differentially expressed in primary fibroblasts from P1 (|log2(FC)| > 1 and adj. p-value < 0.05) relative to CTLs. Genes differentially expressed in P1 and P2 relative to the control group at 2 and 8 hours from among those differentially expressed at both timepoints relative to non-stimulated fibroblasts in the control group, i.e., with a |log2(FC)| > 1 and adj. p-value < 0.05 after Benjamini-Hochberg correction in controls, and with a |log2(FC)| > 1 and adj. p-value < 0.05 after correction in patients relative to controls. (D) RNA-sequencing of IFN-α2b-inducible genes (logFC>2 in controls) in primary fibroblasts with and without IFN-α2b stimulation. (E) HOMER de novo motif analysis of genes differentially expressed in primary fibroblasts with IFN-α2b stimulation. (F) Influenza A virus (IAV), (G) encephalomyocarditis virus (EMCV), (H) vesicular stomatitis Indiana virus (VSV), (I) HSV-1, (J) SARS-CoV-2, and (K) HIV-2 infection of SV40-fibroblasts after pretreatment with IFN-α2b or IFN-γ. All viral infections were performed in 2–3 independent experiments.
