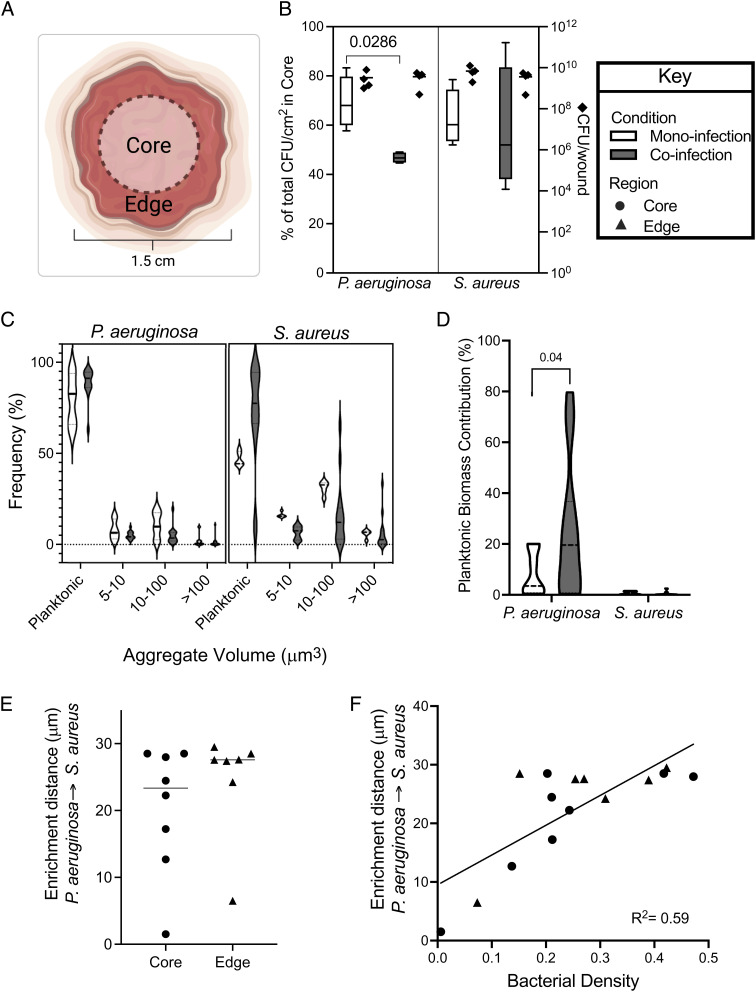
Fig. 2.
Characterization of S. aureus and P. aeruginosa biogeography and spatial distribution in murine wounds. (A) Diagram of the core and edge regions of a mouse wound. (B) Percent of the total P. aeruginosa and S. aureus CFU normalized by surface area found in the core of mono- (open bar) or co-infected (closed bars) wounds (left ordinate). Total bacterial CFU of each wound (diamond) is plotted on the right ordinate. Statistical significance was determined with a Mann–Whitney test. Four animals were used per condition. (C) Frequency of P. aeruginosa or S. aureus objects in each size bin in the core of mono- (open) and co-infected (closed) murine chronic wounds. (D) Percentage that planktonic cells contribute to the total bacterial biomass in mono- (open) and co-infected (closed) wounds. Statistical significance was determined using a Student’s t test. (E) Enrichment distance, defined as the distance in which proportional occupancy of S. aureus from P. aeruginosa is highest, in the core (circle) or edge (triangle) of murine wounds coinfected with S. aureus and P. aeruginosa. (F) Relationship between bacterial density and enrichment distance in the core (circle) or edge (triangle) of murine wounds coinfected with S. aureus and P. aeruginosa. R2 was determined by a nonlinear best-fit line.

