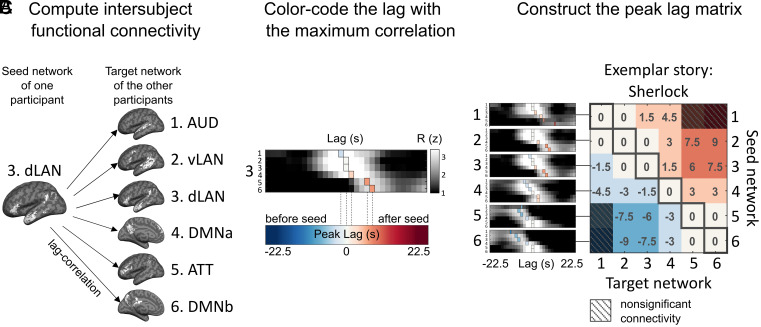
Fig. 2.
Construction of the internetwork peak lag matrix. (A) Lag-ISFC (cross-correlation) between seed-target network pairs were computed using the leave-one-subject-out method. The dLAN network is used as an example seed network for illustrative purposes. (B) The matrix depicts ISFC between the dLAN seed and all six target networks at varying lags. The lag with the peak correlation value (colored vertical bars) was extracted and color-coded according to lag. For visualization, the lag-ISFCs were z-scored across lags. (C) The network × network peak lag matrix (P < 0.05, FDR corrected). Warm colors represent peak lags following the seed network, while cool colors represent peak lags preceding the seed network; zeros along the diagonal capture the intranetwork ISC. An example story (“Sherlock”) is shown for illustrative purposes.

