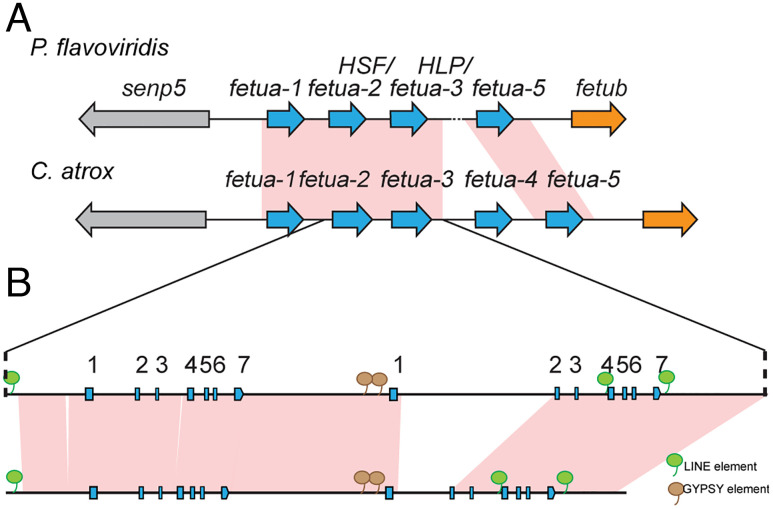
Fig. 8.
The synteny of C. atrox and P. flavoviridis fetua-2 and fetua-3 loci confirms functional shifts in the two paralogs. (A) Schematic showing synteny of the fetua gene complexes of P. flavoviridis and C. atrox (not to scale). Syntenic regions are connected by pink (>90% identity) connecting blocks as determined by BLAST Z. A fetua-4 gene is not detected in P. flavoviridis due to an ambiguous stretch of the nucleotide sequence (dotted line). The contiguous regions are indicated by solid lines. (B) A magnified view comparing the fetua-2 and fetua-3 gene loci in P. flavoridis and C. atrox. The exons are indicated by boxes, and arrows indicate the direction of transcription. Brown bubbles indicate the positions of shared Gypsy elements, while green bubbles indicate the positions of shared LINE elements as determined by the Repeatmasker program.

