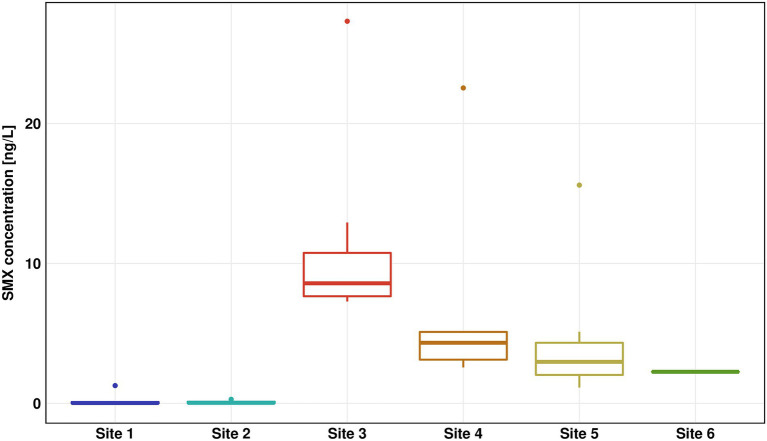
Figure 2.
Sulfamethoxazole (SMX) concentration for all six sites measured by high performance liquid chromatography–mass spectrometry (HPLC-MS)/mass spectrometry (MS). The results of seven replicates are shown using box-whiskers-plots with the median represented by a horizontal line. Colors are representing the different sites (Site 1 in blue, Site 2 in turquoise, Site 3 in red, Site 4 in orange, Site 5 in yellow, and Site 6 in green).

